Figures & data
Figure 1 Storage (G’) and loss (G”) moduli of dispersions of CFPI gels at 100 g kg1 as a function frequency and storage time at pH 2 (a) and 6 (b).
Figure 2 Evolution of storage modulus at 1 rad/s (G’1) for CFPI gels at 100 g kg1 as a function of storage time at pH 2 and 6. (Color figure available online.)
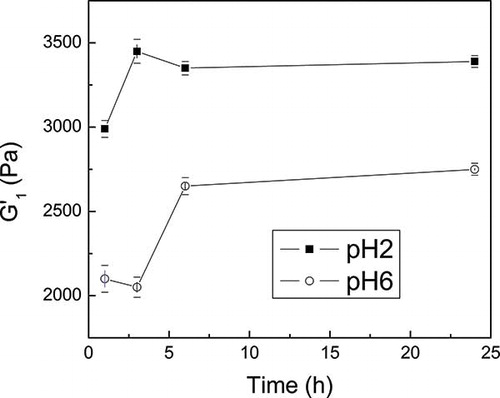
Figure 3 Storage (G’) and loss (G”) moduli of dispersions of CFPI gels at pH 6 at different protein concentration obtained after heating on a thermostatic bath (AHB).
Figure 4 Storage and loss moduli at 1 rad/s (G’1 and G”1) of dispersions of CFPI at pH 6 as a function of protein concentration: before heating (BH), after heating on the rheometer (AHR) and after heating on a thermostatic bath (AHB). (Color figure available online.)
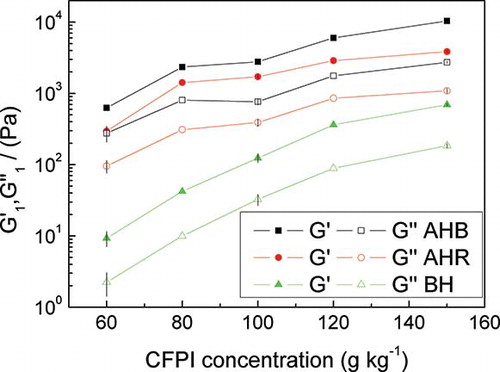
Figure 5 Water holding capacity (WHC) of thermal-treated (90°C, 30 min) crayfish protein isolates gels at pH 6 as a function of protein concentration (CFPI).
Figure 6 SEM micrographs of thermal-treated (90°C, 30 min) crayfish protein isolates (CFPI) gels at pH 6. (a) 100 g kg1, and (b) 150 g kg1. Magnification is shown in each photograph.