4,459
Views
24
CrossRef citations to date
0
Altmetric
Original Articles

Structural and Functional Properties of Ovalbumin Glycated by Dry-Heating in the Presence of Maltodextrin

, , &
Pages 1326-1333 | Received 09 Aug 2011, Accepted 31 Aug 2011, Published online: 03 Mar 2015

Figures & data

TABLE 1 Secondary structure content, surface hydrophobicity (S0), and solubility of OVAs

FIGURE 1 SEM images of OVAs. All micrographs were 500× magnified.

FIGURE 1 SEM images of OVAs. All micrographs were 500× magnified.

FIGURE 2 Some structural and functional characteristics of OVAs. (a) CD spectra of N-, DH-, and G-OVA. Samples were dissolved in 20 mM phosphate buffer (pH 7.4) at a concentration of 0.01 g/L. (b) Tryptophan fluorescence spectra of OVAs. The excitation wavelength was 280 nm and the emission was scanned from 300 to 400 nm. Fluorescence spectra of sample were measured at 0.01 g/L in triplicate. (c) Stability against heat-induced insolubility of N-, DH-, and G-OVA at various temperatures. The protein sample was 1 g/L in 50 mmol/L Tris–HCl buffer (pH 7.0), and heated at various temperatures for 10 min. Data shown are the mean value of the two determinations, with a deviation of less that 1%. (d) Emulsifying properties given as turbidity (A500 nm) of N-, DH-, and G-OVA as a function of standing time after emulsification. The turbidity of the emulsion is plotted as the ordinate and standing time after emulsion formation as the abscissa. Each value is the mean with its SD (n = 3).

FIGURE 2 Some structural and functional characteristics of OVAs. (a) CD spectra of N-, DH-, and G-OVA. Samples were dissolved in 20 mM phosphate buffer (pH 7.4) at a concentration of 0.01 g/L. (b) Tryptophan fluorescence spectra of OVAs. The excitation wavelength was 280 nm and the emission was scanned from 300 to 400 nm. Fluorescence spectra of sample were measured at 0.01 g/L in triplicate. (c) Stability against heat-induced insolubility of N-, DH-, and G-OVA at various temperatures. The protein sample was 1 g/L in 50 mmol/L Tris–HCl buffer (pH 7.0), and heated at various temperatures for 10 min. Data shown are the mean value of the two determinations, with a deviation of less that 1%. (d) Emulsifying properties given as turbidity (A500 nm) of N-, DH-, and G-OVA as a function of standing time after emulsification. The turbidity of the emulsion is plotted as the ordinate and standing time after emulsion formation as the abscissa. Each value is the mean with its SD (n = 3).

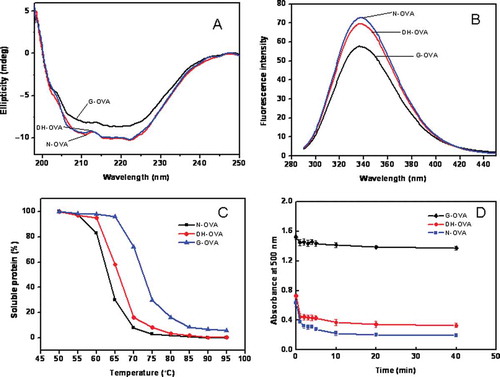
TABLE 2 Some functional properties of N-, DH-, and G-OVA

Reprints and Corporate Permissions

Please note: Selecting permissions does not provide access to the full text of the article, please see our help page How do I view content?

To request a reprint or corporate permissions for this article, please click on the relevant link below:

Academic Permissions

Please note: Selecting permissions does not provide access to the full text of the article, please see our help page How do I view content?

Obtain permissions instantly via Rightslink by clicking on the button below:

If you are unable to obtain permissions via Rightslink, please complete and submit this Permissions form. For more information, please visit our Permissions help page.