Figures & data
FIGURE 1 PCA of EVOO, PSO, and other vegetable oils: (a) score plot and (b) loading plot. GSO: grape seed; CO: corn; SeO: Sesame; SFO: Sunflower; SO: soybean; WO: walnut; RBO: Rice bran; PSO: Pumpkin seed; PO: palm; CaO: canola oil.
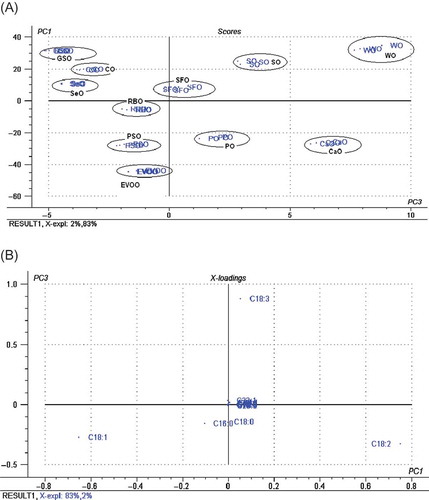
FIGURE 2 (a) FTIR normal spectra of extra virgin olive oil and pumpkin seed oil, scanned at mid infrared region (4000–650 cm−1). The first derivative FTIR spectra at frequency region of 3050–2800 (b), and at 1100–900 cm−1 (c).
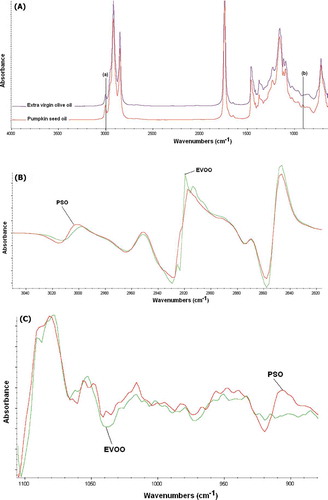
TABLE 1 The performance of multivariate calibrations for analysis of PSO blended into EVOO
TABLE 2 The contents of major fatty acids in PSO blended into EVOO, as determined using GC–FID
FIGURE 3 The number of factor or latent variables used for modeling PLS calibration.
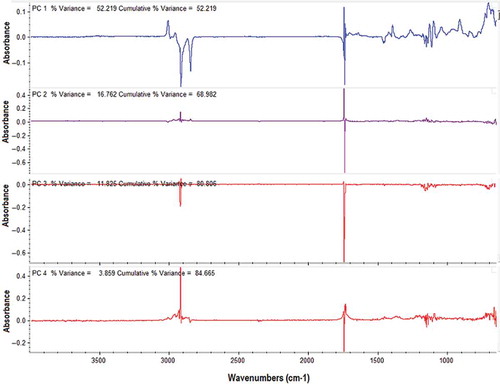
FIGURE 4 The Coomans plot for the classification of EVOO and that mixed with pumpkin seed oil (PSO). (□) Pure EVOO; (Δ) EVOO blended with PSO.
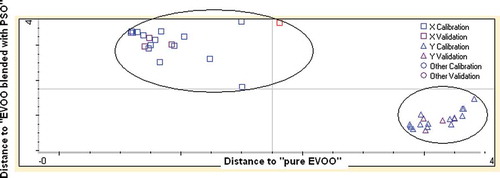
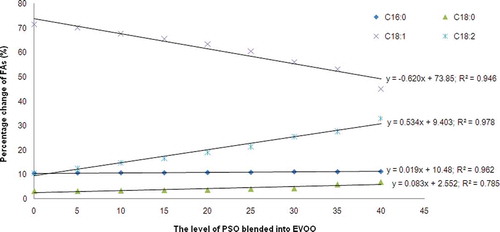
FIGURE 5 The percentage changes of main FAs during the blending of PSO with certain levels (0, 5, 10, 15, 20, 25, 30, 35, and 40% vol/vol) into EVOO.