Figures & data
FIGURE 1 (a) Overall view and (b) schematic diagram of the bioyield apparatus developed.
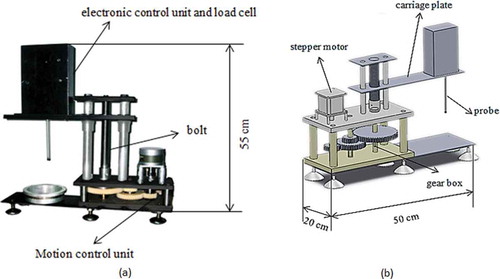
TABLE 1 Characteristics of the 39 bioyield probes used for the bioyield measurement of apple and peach fruits
FIGURE 2 Schematic diagram of a typical probe (t and d are thickness of tip rubber and diameter of probe, respectively).
FIGURE 3 Bioyield and MT firmness measurement locations at the equator of an apple (left) and of a peach (right).
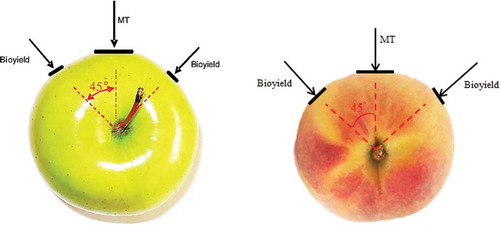
FIGURE 4 Force-deformation curve for apple fruit under compression by one of the probes (4.8 mm dia., 2.56 MPa elastic modulus of rubber tip and rubber tip thickness of 4.8 mm).
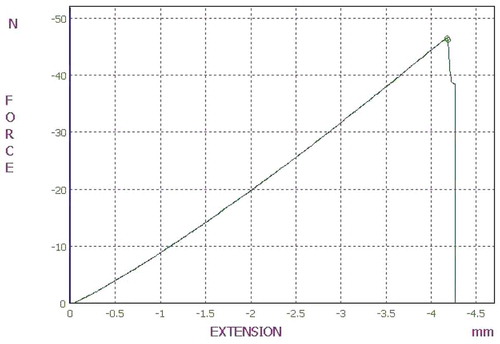
TABLE 2 Relationship between the bioyield firmness (N) and MT firmness (N) for E probe with different tip designs at three loading rates (mm min−1) for apples
FIGURE 5 Correlation between MT firmness and bioyield force, using the selected probe (E-am) for apple fruit at 6 mm min−1 loading rate.
TABLE 3 Relationship between the bioyield firmness (N) and MT firmness (N) for various probe designs at three loading rates (mm min−1) for peaches
FIGURE 6 Correlation between MT firmness and bioyield force, using the selected probe (E-as) for peach fruit at 9 mm min−1 loading rate.
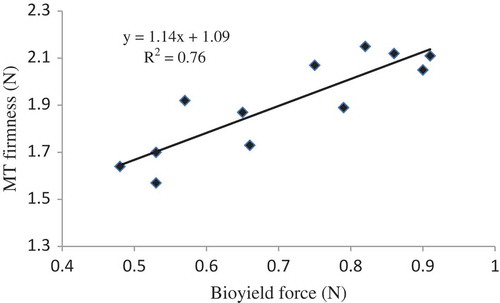
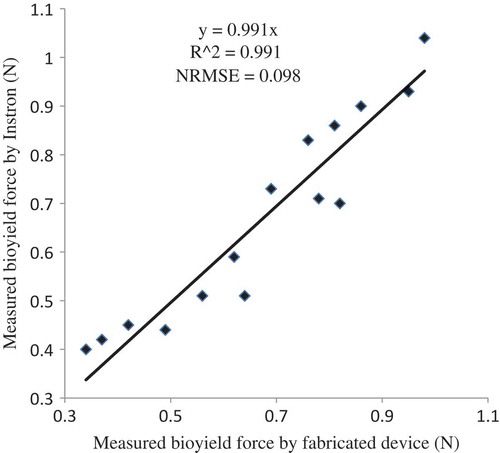
FIGURE 7a Comparison of measured bioyield force by fabricated apparatus with the Instron, using the selected probe (E-am) for apple fruit at 6 mm min−1 loading rate.
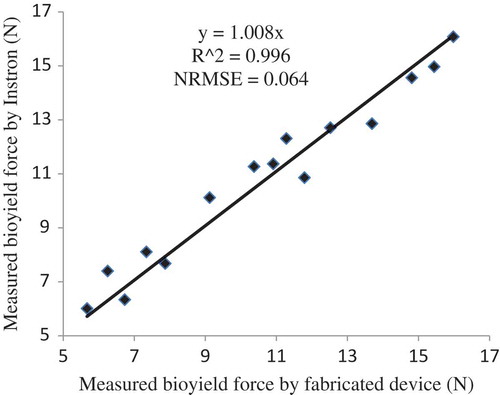
FIGURE 7b Comparison of measured bioyield force by fabricated apparatus with the Instron, using the selected probe (E-as) for peach fruit at 9 mm min−1 loading rate.