
Figures & data
TABLE 1 Hybrids and their parental forms analyzed in the study
TABLE 2 Average log(Abs.) values for the analyzed hybrids and parental forms in the wavenumber ranges corresponding to lipids, amides (I, II, and III), and saccharides; wavenumber ranges were divided based on significant differences between the tested genotype groups
FIGURE 1 FTIR-ATR spectra for the grain of hybrids and their parental forms. The ranges for lipids, amides I, II, and III, and carbohydrates follow Nauman et al.[Citation14] The results are expressed as log of absorbance values (log(Abs.)).
![FIGURE 1 FTIR-ATR spectra for the grain of hybrids and their parental forms. The ranges for lipids, amides I, II, and III, and carbohydrates follow Nauman et al.[Citation14] The results are expressed as log of absorbance values (log(Abs.)).](/cms/asset/80d2e805-9786-487d-a339-96ff6c9f66d7/ljfp_a_814665_f0001_oc.jpg)
FIGURE 2 First derivative of FTIR-ATR spectra for the grain of hybrids and their parental forms. The ranges for lipids, amides I, II, and III, and carbohydrates follow Nauman et al.[Citation14]
![FIGURE 2 First derivative of FTIR-ATR spectra for the grain of hybrids and their parental forms. The ranges for lipids, amides I, II, and III, and carbohydrates follow Nauman et al.[Citation14]](/cms/asset/97ecc6ab-8f3d-4830-8773-b3e8afc826c6/ljfp_a_814665_f0002_oc.jpg)
FIGURE 3 Discriminant analysis of FTIR-ATR spectra (log(Abs.)) for wavenumber ranges 575–4500 cm−1. Confidence ellipses were plotted for a probability of 0.669.
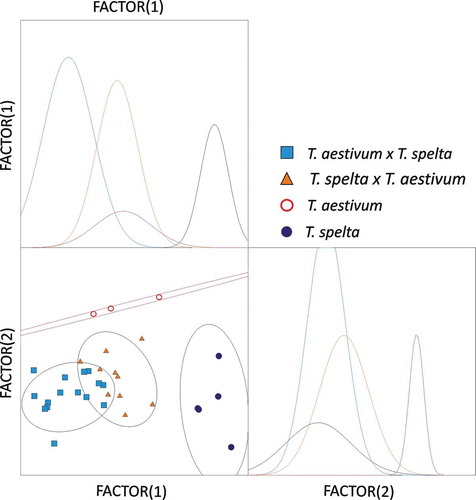
TABLE 3 Average values of the first derivates of absorbance spectra for the analyzed hybrids and parental forms in the wavenumber ranges corresponding to lipids, amides (I, II, and III), and saccharides; wavenumber ranges were divided based on significant differences between the tested genotype groups