Figures & data
TABLE 1 Experimental variables for biscuits, their coded and uncoded (actual) values
TABLE 2 Regression coefficients of full second order model and significant terms for different properties of low-fat soft dough biscuits containing polydextrose and guar gum
FIGURE 1 Contour plot representing the effect of different variables on quality of biscuits (X1: sugar; X2: composite fat; X3: ammonium bicarbonate; X4: water).
TABLE 3 Physical characteristics of different types of biscuits*
TABLE 4 Chemical characteristics of different types of biscuits*
TABLE 5 Changes in moisture content (%) of biscuits during storage*
FIGURE 2 Changes in peroxide value (meq of O2/kg of fat) of biscuits during storage.
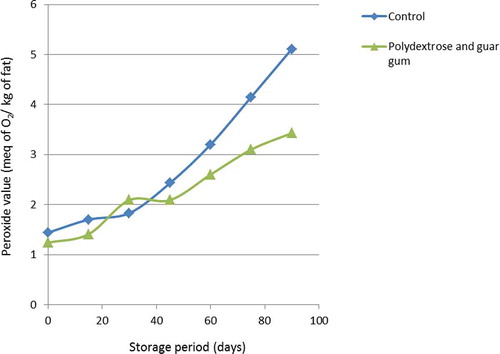
FIGURE 3 Changes in free-fatty acid content (%) of biscuits during storage.
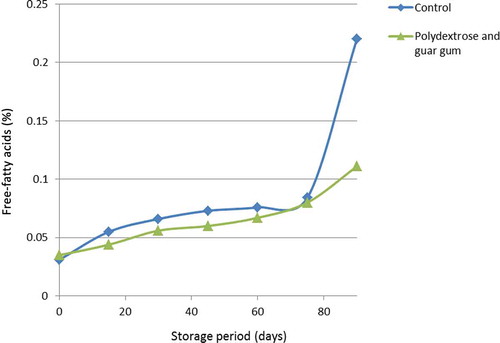
TABLE 6 Changes in hardness (N) of biscuits during storage*
FIGURE 4 Changes in taste scores of optimized products during storage.
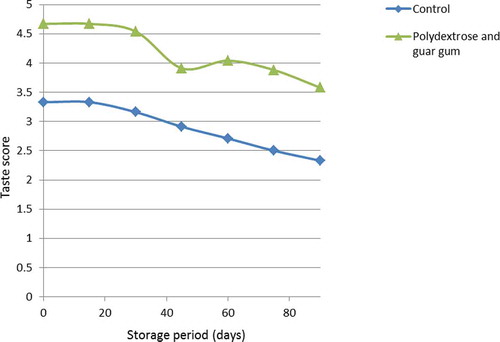
FIGURE 5 Changes in flavor scores of optimized products during storage.
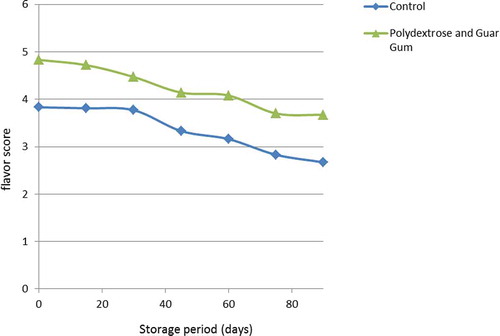
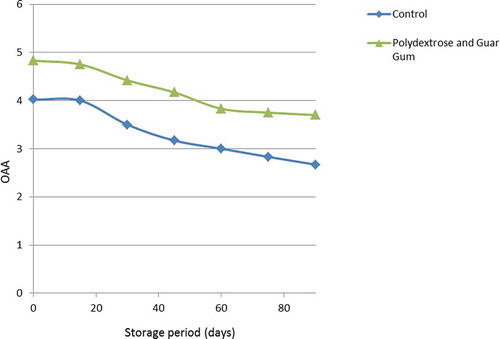
FIGURE 6 Changes in overall acceptability (OAA) scores of biscuits during storage.