Figures & data
FIGURE 1 Mean values of aged wine’s phenolic acids.
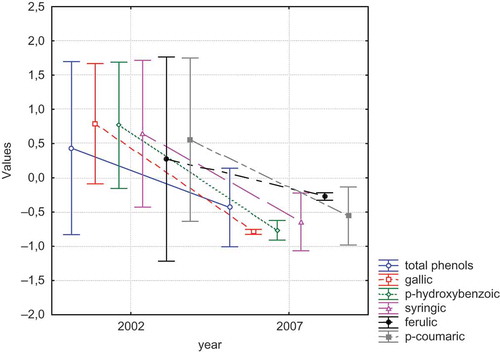
FIGURE 2 Mean values of phenolic acids in aged wines produced from different grape varieties.
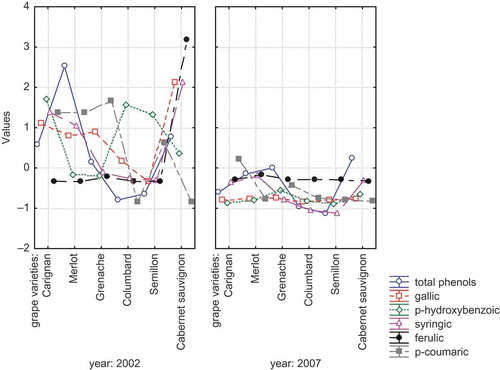
FIGURE 3 Distribution of phenolic acids and total phenols present in aged wines.
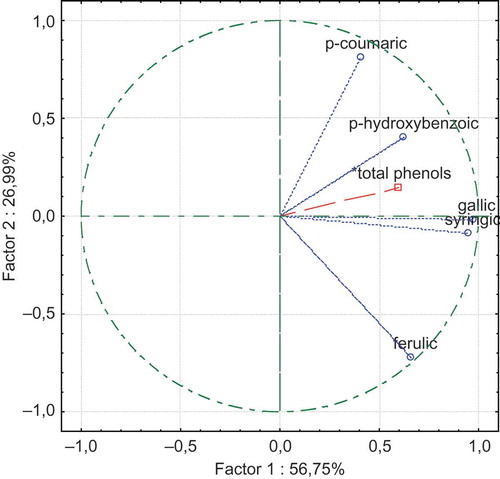
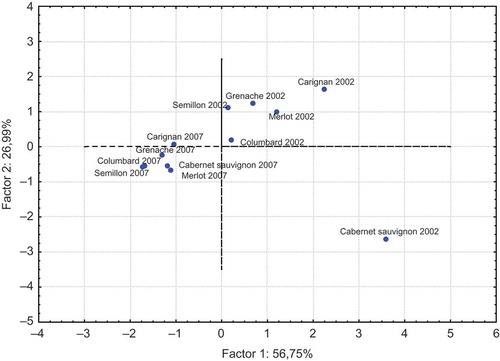
FIGURE 4 Distribution of wines according to the their aging year and grape variety origin.