Figures & data
TABLE 1 Physical properties of the test macroporous resins
FIGURE 1 The adsorption and desorption ratios, adsorption capacity of anthocyanins on different resin.
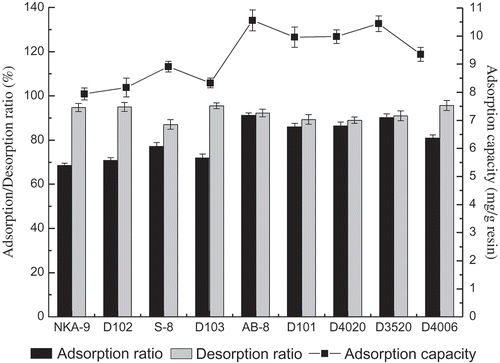
FIGURE 2 Adsorption and desorption kinetics for anthocyanins on two resins, and adsorption isotherm, dynamic breakthrough, and diffusion curves for anthocyanins on AB-8 resin. (A) Adsorption kinetics curves for anthocyanins on two resins; (B) desorption kinetics curves for anthocyanins on two resins; (C) adsorption isotherms for anthocyanins on AB-8 resin; (D) dynamic breakthrough curve for anthocyanins on AB-8 resin; (E) dynamic desorption curve for anthocyanins on AB-8 resin.
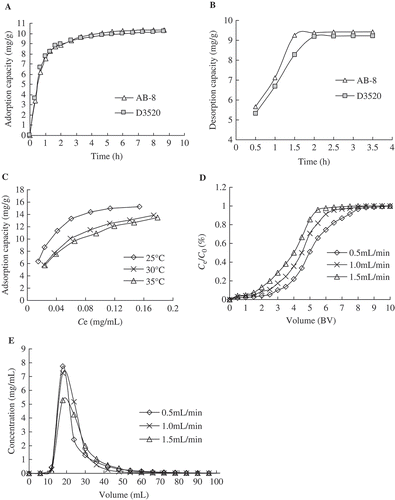
TABLE 2 Langmuir and Freundlich adsorption parameters of anthocyanins on AB-8 resin at different temperatures
TABLE 3 Effect of different ethanol-water solutions on the static desorption ratio of anthocyanins on AB-8 resin
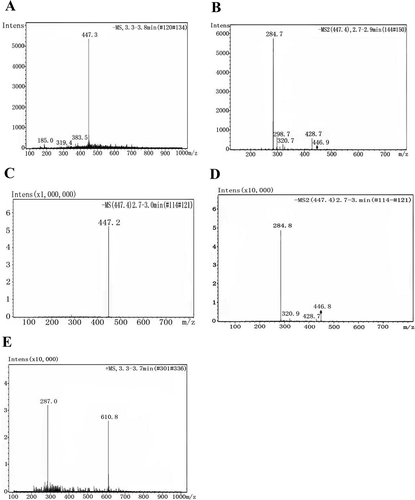
FIGURE 3 Mass spectra of fraction 1 and 2. (A) MS spectra in negative mode of fraction 1; (B) MS2 spectra in negative mode of fraction 1; (C) MS spectra in negative mode of standard of cyaniding-3-glucoside; (D) MS2 spectra in negative mode of standard of cyaniding-3-glucoside; and (E) mass spectrum of fraction 2 obtained with ESI ionization.