Figures & data
FIGURE 1 Acidity changes during baking (n = 3).
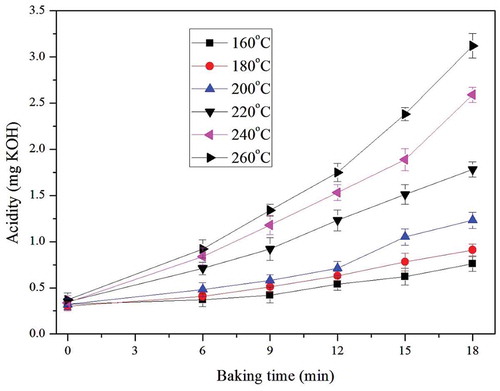
TABLE 1 Numerical values for the change of acidity during baking
FIGURE 2 T1: Linear regression of acidity on baking time; T2: Arrhenius plot of increase rate constant versus reciprocal temperature (K) for acidity.
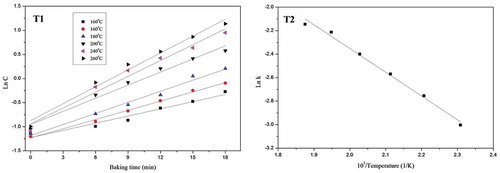
TABLE 2 Numerical values for the change of acidity during storage
FIGURE 3 T1: Acidity changes during storage; T2: Arrhenius plot of increase rate constant versus reciprocal temperature (K) for acidity in storage.
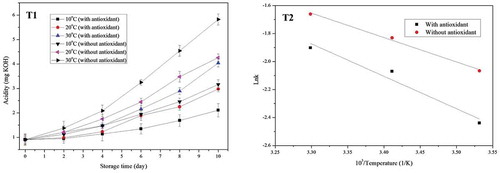
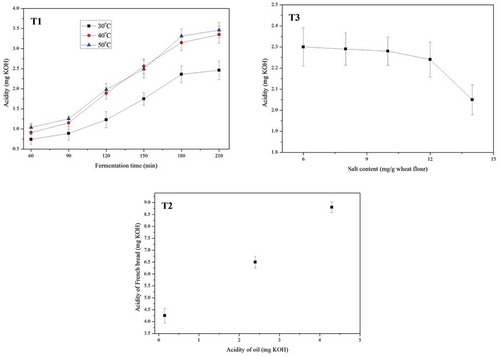
FIGURE 4 T1: Impact of fermentation on acidity; T2: Impact of oil quality on acidity; T3: Impact of salt on acidity.