Figures & data
FIGURE 1 PEF processing.
FIGURE 2 Inactivation of PEF on E. coli and S. cerevisiae: (a) E. coli, electric field strength, treatment time; (b) S. cerevisiae, electric field strength, treatment time; (c) E. coli, electric field strength, conductivity; (d) S. cerevisiae, electric field strength, conductivity.
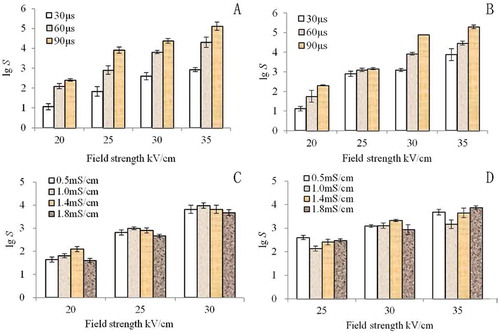
FIGURE 3 SEM image of PEF-treated cells of S. cerevisiae: (a) control; (b) PEF-treated cells (30 kV/cm, 60 μs); (c) PEF-treated cells (35 kV/cm, 90 μs).
FIGURE 4 PEF-treated cells of S. cerevisiae observed using TEM: (a) control; (b) PEF-treated cells (30 kV/cm, 60 μs); (c) PEF-treated cells (35 kV/cm, 90 μs).
TABLE 1 Amount of UV-absorbing materials from S. cerevisiae leaked into the suspension after PEF treatment
TABLE 2 FCM result of S. cerevisiae after PEF treatment
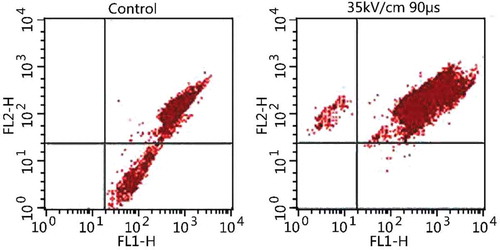
FIGURE 5 FCM result of S. cerevisiae after PEF treatment.
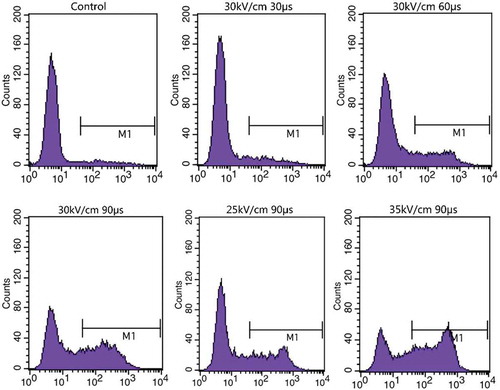
FIGURE 6 Effect of PEF treatment on the DNA denaturation in S. cerevisiae cells. Upper left and lower right corners represent red and green fluorescence, respectively. The upper right corner represents the red and green fluorescent coexisting region.