
Figures & data
FIGURE 1 Single column test stand (model AEL, Ali Instrument Co., Ltd., ZJ, China) equipped with a 100 mm diameter top plate to compress a fruit against a large base plate. The initial distance between the top plate and the top point of a fruit d was 10 mm. The figure indicates how three locular tomato fruits would be loaded by the top plate at position 1.
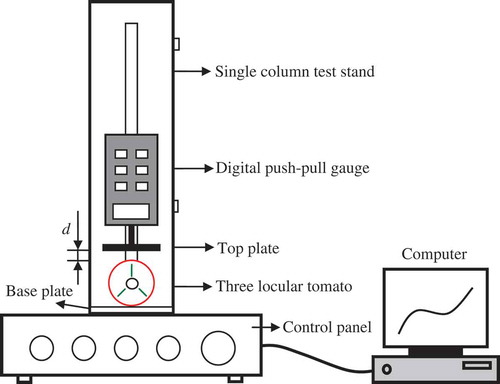
FIGURE 2 Three and four locular tomato fruits, (a) Three locular tomato fruit and its simplified equatorial section; (b) Four locular tomato fruit and its simplified equatorial section. Numbers 1, 2, and 3 represent loading positions 1, 2, and 3, respectively.
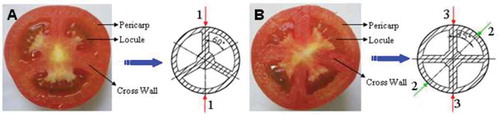
FIGURE 3 (a) Typical loading-unloading curve for compression of a three locular tomato fruits to 4% final deformation at a compression speed of 1.5 mm s−1; (b) compression energy of tomato fruits at different loading positions for each compression speed; (c) peak force of tomato fruits at different loading positions for each compression speed; (d) loading slope of tomato fruits at different loading positions for each compression speed. T × CW: loading position over a cross wall of three locule fruits; F × L: loading position over locular tissue of four locule fruits; F × CW: loading position over a cross wall of four locule fruits. The error bars represent 95% confidence limits.
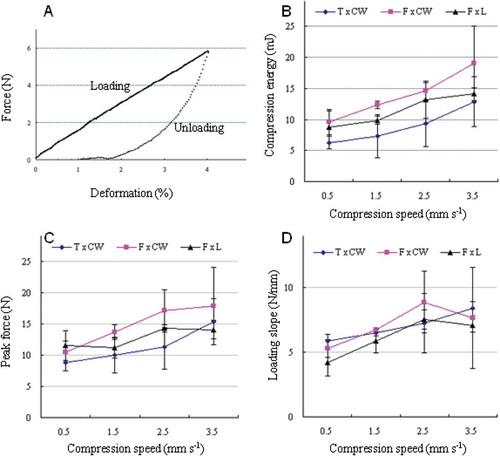
TABLE 1 Size, shape, and mass of tomato fruits (mean value ± 95% confidence limits)
TABLE 2 Model 1, 2, and 3 with Ec, Fmax, rk as the dependent variable, respectively
TABLE 3 Pearson correlation coefficient matrix for the mechanical parameters