Figures & data
TABLE 1 Variability (average, standard deviation [SD], and range) of each textural parameter in studied plant material. Effects of variety (V), repetition (R), and environment (E) were expressed as percentages of total sums of squares type III. Analysis of variance (ANOVA) was executed and a Duncan test was conducted to provide significant differences (P < 0.05)
FIGURE 1 Studied melon varieties clustered by textural parameters. Euclidean distances were calculated and Ward’s method was used, resulting in three melon typologies. Main parameters for each centroid cluster.
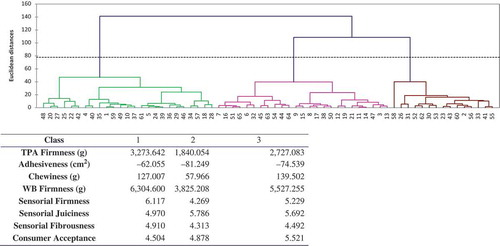
TABLE 2 Pearson’s correlations
FIGURE 2 Preference map and principal component analysis.
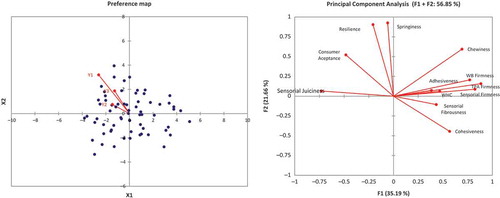
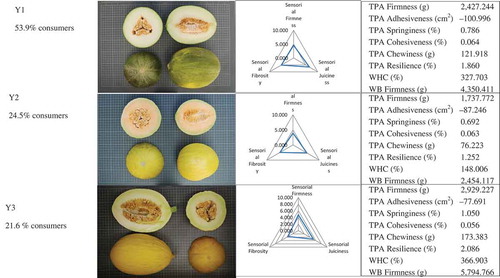
FIGURE 3 Three consumer typologies. The preferred melon type of each group. Sensory profile of texture. Mechanical instrumental results.