Figures & data
TABLE 1 Independent variables and levels of a rotatable central composite design (RCCD) used in the present study for aloe vera juice
TABLE 2 The matrix of RCCD followed in this study and experimental data obtained of rheological properties and PME activity of aloe vera juice
FIGURE 1 Experimental flow curves for aloe vera juice at 25°C processed under different conditions of pressure, dwell time, and pH. (Mean values plotted, N = 4, SD < ±10% for shear stress; SD < ±5 for apparent viscosity, SS = shear stress, and AV = Apparent viscosity.)
FIGURE 2 Response surface plots showing the effect of pressure level, dwell time, and pH on consistency index (a and b), flow behavior index (c and d), and yield stress (e and f) of aloe vera juice.
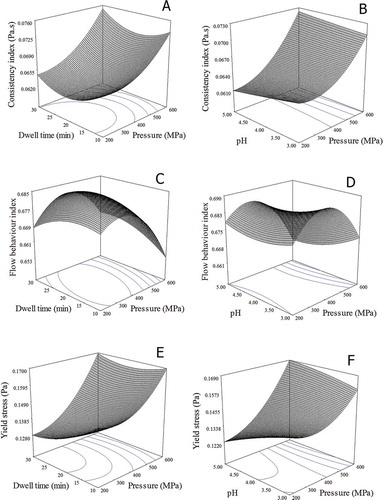
FIGURE 3 Cloud loss and settling in aloe vera juice.
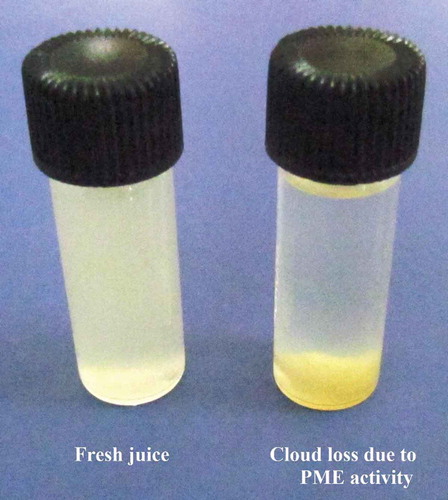
FIGURE 4 Effect of pressure level, dwell time, and pH on % residual activity of in situ PME enzyme in aloe vera juice.
FIGURE 5 Contour plots of pressure-pH (a) and pressure-dwell time (b) showing iso --- (%) inactivation lines for in situ PME enzyme of aloe vera juice within the studied domain of pressure, dwell time, and pH.
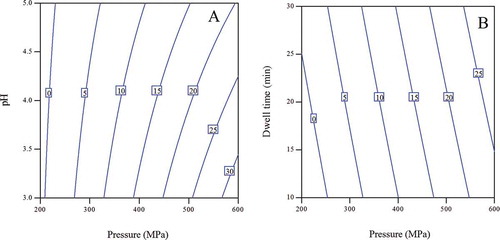
TABLE 3 Experimental data for microbiological characteristics of aloe vera juice
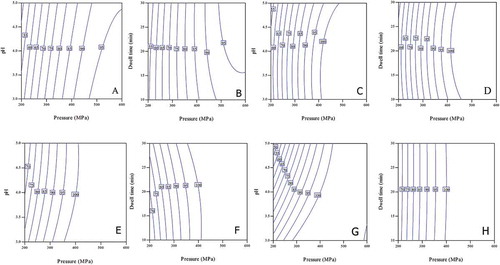
FIGURE 6 P-t and P-pH contour plots showing iso --- (%) reduction lines for AMC (a and b), Y&M (c and d), LAB (e and f) and TC (g and h) counts in aloe vera juice within the studied domain of pressure, dwell time, and pH.