
Figures & data
TABLE 1 Q-FFD factorial design and concentration levels of the additives for the CSO blends
TABLE 2 Fatty acid composition analyses results for frying CSO blend oils during frying process (%w/w)
FIGURE 1 The rate of ∑PUFA/∑SFA during frying time for fresh deodorized CSO.
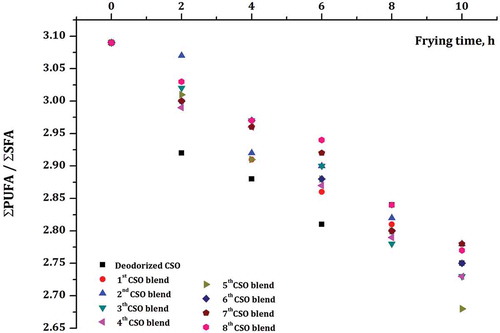
TABLE 3 Probability and effect values of the additives for fatty acid composition and tocopherol analyses
FIGURE 2 Normal distribution curve of the CSO blends for (a) fatty acid composition and (b) tocopherol analysis with the effects of different additives; ascorbic palmitate (A), mixed tocopherols (B), dimethylpolysiloxane (DMPS) (C), lecithin (D), cold-pressed sesame oil (E).
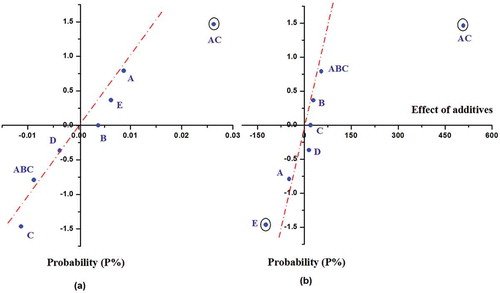
FIGURE 3 Tocopherol composition chromatograms obtained from HPLC-FLD system for frying deodorized CSO analyses.
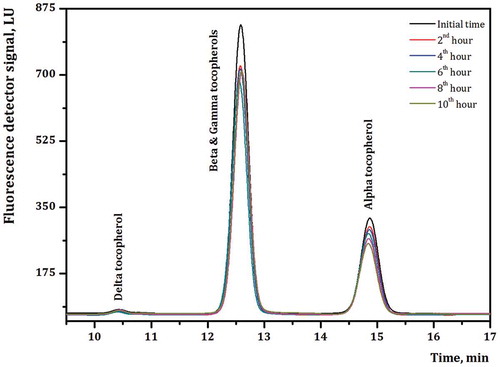
TABLE 4 Tocopherol analyses results for frying CSO blend oils (∑ tocopherol, mg/kg oil)