Figures & data
FIGURE 1 The appearance of dried tilapia bones treated with papain and Ca(OH)2. Bones in the row above were tilapia bones treated with papain; Bones in the row below were tilapia bones treated with Ca(OH)2.
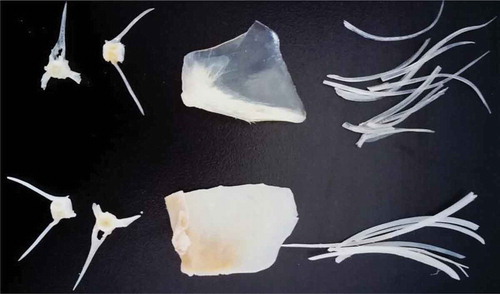
FIGURE 2 SEM micrographs of the surface morphology and microstructure of tilapia opercular which treated with papain and Ca(OH)2. (A1) surface of desalinated opercular; (A2) section of desalinated opercular; (B1) surface of desalinated opercular treated with Ca(OH)2; (B2) section of desalinated opercular treated with Ca(OH)2; (C1) surface of desalinated opercular treated with papain; (C2) section of desalinated opercular treated with papain.
FIGURE 3 DSC thermograms of tilapia bones treated with papain and Ca(OH)2.
FIGURE 4 The SDS-PAGE patterns of PT and AT gelatin. Lane 1: first PT gelatin; Lane 2: second PT gelatin; Lane 3: third PT gelatin; Lane 4: standard protein; Lane 5: first AT gelatin; Lane 6: second AT gelatin; Lane 7: third AT gelatin; Lane 8: first channel catfish head bone gelatin. Molecular weights from top to bottom in the standard protein are 97,400, 66,200, 43,000, 31,000, and 20,000Da, respectively.
FIGURE 5 Fourier transform infrared spectrum of AT1 (first AT gelatin), PT1 (first PT gelatin), and porcine skin gelatin.
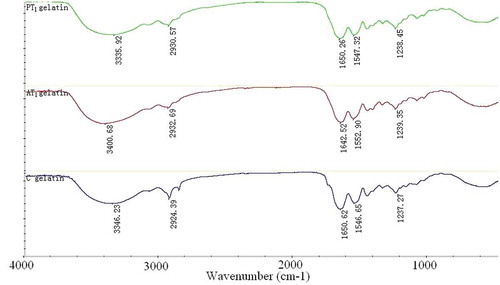
TABLE 1 Mean amino acid compositions for PT and AT (residues/1000)
FIGURE 6 Gel strengths of gelatins extracted from tilapia bone.
FIGURE 7 Yields of gelatins extracted from tilapia bone.
FIGURE 8 The pI values of the AT (A) and PT (B) gelatin.
FIGURE 9 Viscosities of gelatins extracted from tilapia bone.
FIGURE 10 Evolution of viscoelastic properties during cooling from 35 to 6°C (1) and heating from 6 to 35°C (2) of 66.7 g L−1 gelatin solutions. (A) the elastic modulus (G’, Pa); (B) the viscosity modulus (G”, Pa); (C) the phase angle (rad).