Figures & data
FIGURE 1 (a) Gel strength of hydrogels with and without GCE at 4ºC; (b) Elastic modulus (G′), viscous modulus (G″), and phase angle of hydrogels with and without GCE.
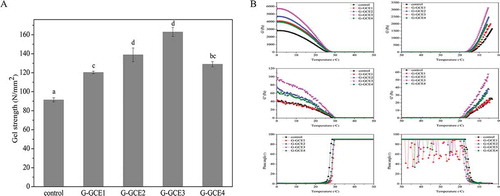
FIGURE 2 (a) DSC thermographs of gelatin with and without GCE; (b) Thermogravimetry (TG) and derivative thermogravimetry (DTG) of gelatin with and without GCE.
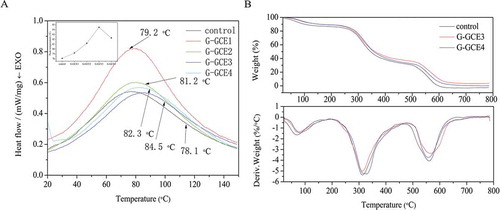
TABLE 1 The temperatures of 50% mass (T50), the residue at 500°C, the temperature corresponding to the maximum rate of mass loss (Tm), the maximum rate of mass loss of the control and different gelatin-GCE
FIGURE 3 Swelling kinetics of xerogels with and without GCE.
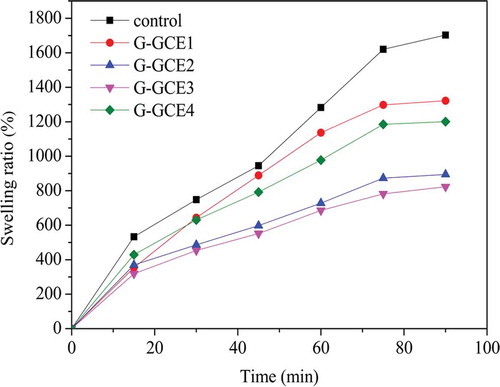
TABLE 2 Degree of crosslinking, expressed as the percent of free ε-amino groups lost after crosslinking
TABLE 3 Crystallinity (Xc) of the samples with different GCE contents
FIGURE 4 (a) X-ray diffraction diagrams of gelatin with and without GCE; (b) FT-IR spectra of gelatin with and without GCE (control and G-GCE3).
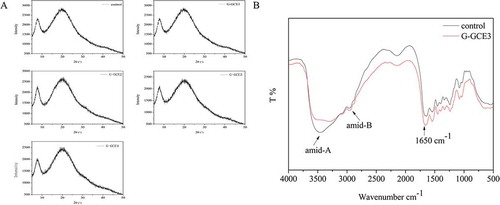
FIGURE 5 SEM micrographs of films surface: (A1) control; (B1) G-GCE3 and SEM micrographs of films cross-sections; (A2) control; (B2) G-GCE3.