
Figures & data
TABLE 1 Protein, fat, and carbohydrate compositions of the powdered foods (mass basis)
TABLE 2 Bulk densities, moisture contents, and thermal conductivities of five powdered foods measured at 20°C
TABLE 3 Comparison of measured data against thermal conductivity bounds
FIGURE 1 Thermal conductivity data for wheat flour along with thermal conductivity bounds.

FIGURE 2 Thermal conductivity data for cocoa along with thermal conductivity bounds.
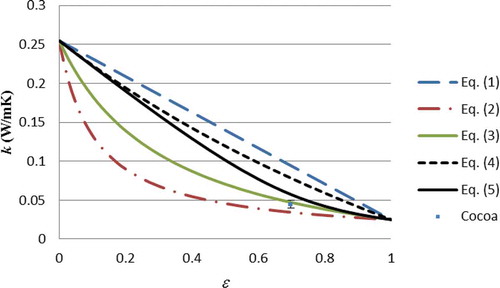
FIGURE 3 Thermal conductivity data for sucrose along with thermal conductivity bounds.
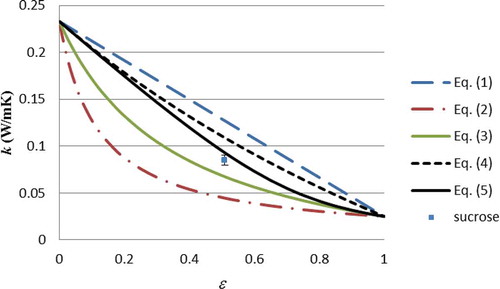
TABLE 4 Comparison of measured data against thermal conductivity predictions