Figures & data
TABLE 1 The values of independent variables used in full factorial design with responses
TABLE 2 Quality characteristics of wheat flour (mean value ± standard deviation)
TABLE 3 Parameters of the grape seed used for obtaining grape seed flour
FIGURE 1 Response surface plots showing the combined effects of gluten deformation index (GDI) and grape seed flour level (GSF) on: A: falling number (FN); B: dough stability (ST); C: C1 torque (C1); D: C2 torque (C2); E: difference between torques C1 and C2 (C1-2); F: C 3 torque (C3); G: difference between torques C3 and C2 (C3-2); H: C 4 torque (C4); I: C 5 torque (C5); and J: difference between torques C5 and C4 (C5-4).
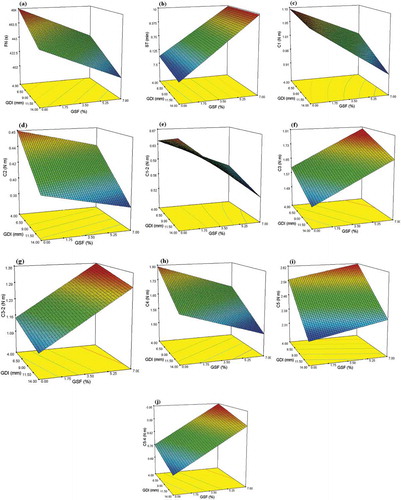
FIGURE 2 Microstructure taken by EFLM of wheat dough with A: 0% grape seed flour and B: 4.08% grape seed flour. Green are starch granules, while red is protein. Images (a1) and (b1; 1x1 pixels, bars = 50 pixels) are higher magnification images of (a) and (b; 2 x 2 mm, bars = 100 pixels) at positions indicated by the squares.
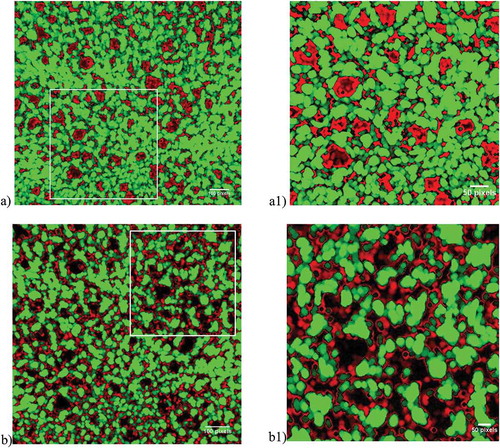
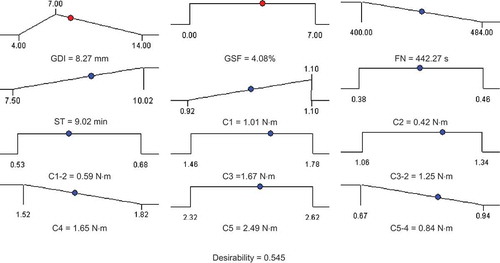
FIGURE 3 Desirability ramp for optimized.