Figures & data
TABLE 1 The concentration of DNA isolate extracted from capsule shells preparing from the mixture of pork and beef
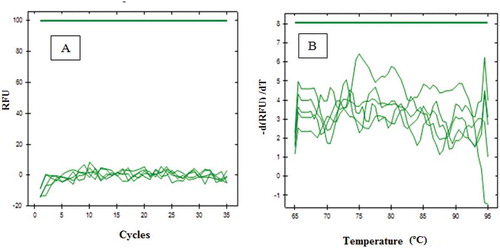
FIGURE 1 Amplification curve (a) and denaturation peak; (b) using primer D-Loop 112 at various annealing temperatures at 52.0, 52.7, 54.0, 55.9, 58.4, 60.3; 61.4, and 62.0ºC, respectively. Light gray (red): from isolate containing porcine gelatin DNA, dark gray (blue): from isolate containing bovine gelatin DNA.
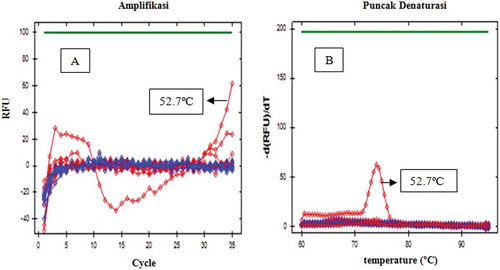
FIGURE 2 Amplification curve (a) and denaturation peak; (b) using primer D-Loop 108 at various annealing temperatures at 52.0, 52.7, 54.0, 55.9, 58.4, 60.3, 61.4, and 62.0ºC, respectively. Light gray (red): from isolate containing porcine gelatin DNA, dark gray (blue): from isolate containing bovine gelatin DNA.
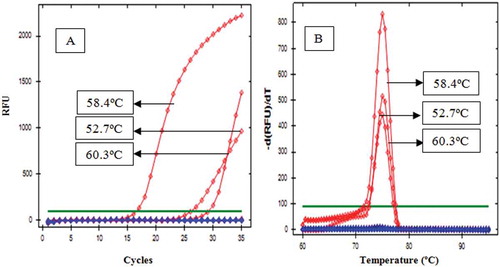
FIGURE 3 Amplification curve (a) and denaturation peak; (b) of DNA from fresh tissue using primer D-Loop 108 at annealing temperature of 58.4.
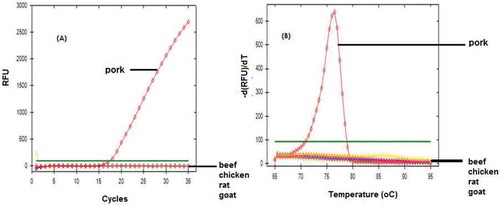
FIGURE 4 Amplification results of porcine gelatin DNA (a) from a dilution series of DNA at several concentrations and its corresponding standard curve (b).
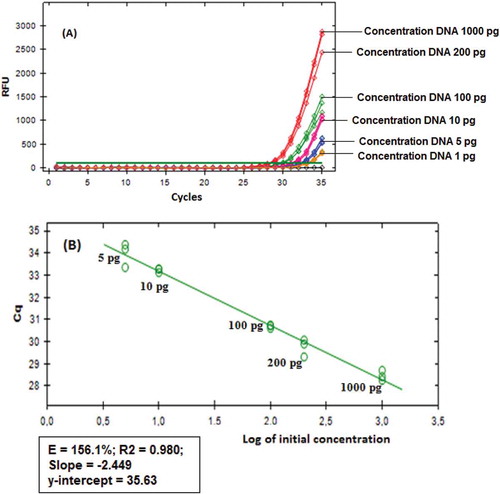
FIGURE 5 Amplication curve of commercial capsule shell containing DNA using primer D-loop 108. (a) Amplification curve; (b) denaturation peak.