2,412
Views
54
CrossRef citations to date
0
Altmetric
Articles

Assessment of phenolic profile of Turkish honeys

&
Pages 864-876 | Received 21 Jan 2016, Accepted 07 May 2016, Published online: 02 Oct 2016

Figures & data

Table 1. Honey samples and their collection regions.

Figure 1. Total ion chromatograms (TIC) of phenolic compounds detected in thyme honey and carob honey.

Figure 1. Total ion chromatograms (TIC) of phenolic compounds detected in thyme honey and carob honey.

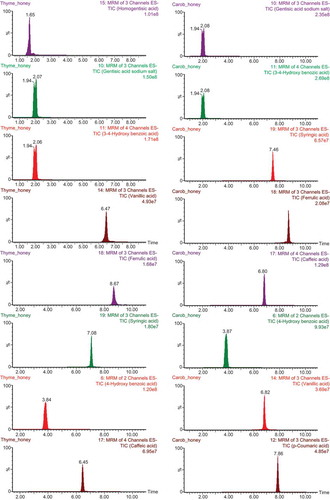
Table 2. Phenolic compounds content of Turkish honeys of different floral origin. Results were expressed as mg/kg ± SD.

Table 3. Antioxidant activities of honey samples by β-carotene-linoleic acid, DPPH, and ABTS+ assays.

Table 4. LoD values, recovery, the regression equations, and correlation coefficients of phenolic compounds.

Reprints and Corporate Permissions

Please note: Selecting permissions does not provide access to the full text of the article, please see our help page How do I view content?

To request a reprint or corporate permissions for this article, please click on the relevant link below:

Academic Permissions

Please note: Selecting permissions does not provide access to the full text of the article, please see our help page How do I view content?

Obtain permissions instantly via Rightslink by clicking on the button below:

If you are unable to obtain permissions via Rightslink, please complete and submit this Permissions form. For more information, please visit our Permissions help page.