
Figures & data
Figure 1. TEM imaging of A: GO and B: XRD pattern of graphite and GO.
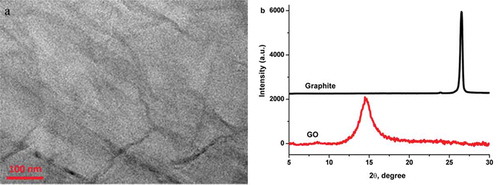
Figure 2. A: N1s and B: C1s core spectra of GC/GO-IPA.
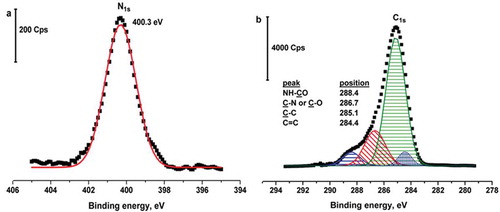
Figure 3. A: Cyclic voltammograms and B: Nyquist plots of 2 mM Fe(CN)63-/4- on the bare GC electrode and GC/GO-IPA.
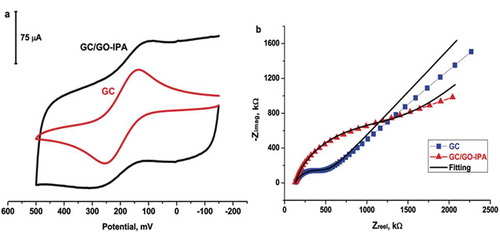
Table 1. Fitting values of EIS data for 2 mM Fe(CN)63-/4- redox probe couple on bare GC and GC/GO-IPA in 100 mM KCl supported electrolyte.
Figure 4. The effect of A: pH, B: deposition time, and C: suspension solution volume.
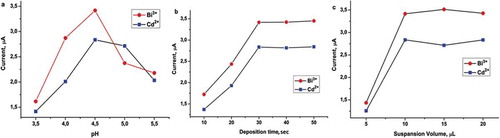
Figure 5. SWASV responses of A: 1×10⁻⁸ M, B: 1×10⁻⁹ M, C: 1×10⁻¹⁰ M, D: 1×10⁻¹¹ M, and E: 1×10⁻¹² M Cd2+ and Bi3+ on the GC/GO-IPA surface (pulse size: 25 mV, Frequency: 25 Hz.).
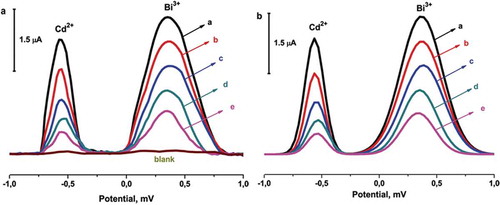
Figure 6. Calibration curves of A: 1×10⁻⁸ M, B: 1×10⁻⁹ M, C: 1×10⁻¹⁰ M, D: 1×10⁻¹¹ M, and E: 1×10⁻¹² M Cd2+ and Bi3+ on the GC/GO-IPA.
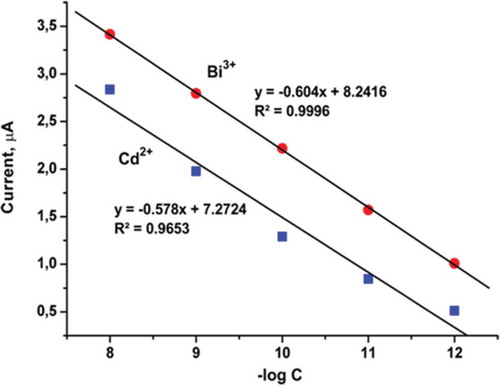
Table 2. The recoveries of Bi3+ and Cd2+ in tap water and milk samples (n = 5).