
Figures & data
Table 1. Retention times, MS spectral characteristics, and identify of phenolic compound present in 15 Pu-erh teas.
Table 2. IC50 values of DPPH and ABTS assay of 15 Pu-erh teas.
Table 3. IC50 values of MTT assay of 15 Pu-erh teas.
Figure 1. Effects of 15 Pu-erh tea extracts at various concentrations on relative viability of SMMC-7721 cells 24 h after treatment (n = 5).
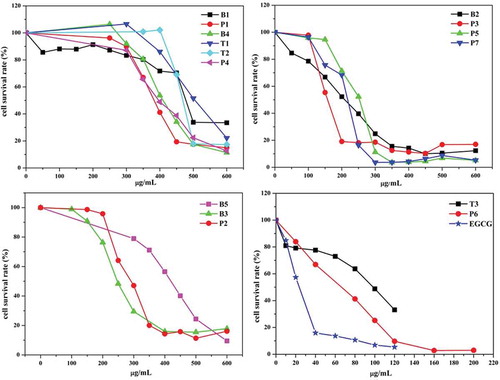
Table 4. The contents of the total polyphenols, total flavonoids, total catechins, free amino acid, total soluble saccharides, purine alkaloids, and gallic acid.
Table 5. Average contents of the main active compounds of Pu-erh tea at four different storage stages.
Table 6. Correlation coefficients between antioxidant and anticancer activities and the main active compound contents.