
Figures & data
Table 1. Chemical characteristics of the individual apple juices from five different batches (a–e): total soluble solids (TSS), sucrose, glucose, fructose, pH, titratable acidity (TA), ratio of TSS/TA, total phenolics, total antioxidant capacity, TEAC, and requirements of the AIJN Code of Practice (CoP) developed by the European Fruit Juice Association.
Table 2. Chemical characteristics of the apple juices in each of the four categories.
Table 3. Loadings for the first four principal components for apple juice samples.
Figure 1. Principal component analysis of the chemical profiles of 90 apple juices, scores plots A: PC1 versus PC2; and B: PC3 versus PC4.
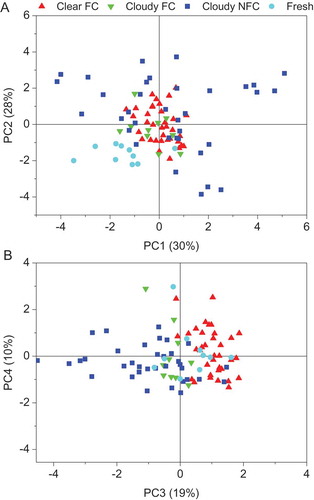
Figure 2. Hierarchical cluster analysis of the chemical profiles of 90 apple juices. Juices: clear FC (red), cloudy FC (green), cloudy NFC (blue), fresh (cyan).
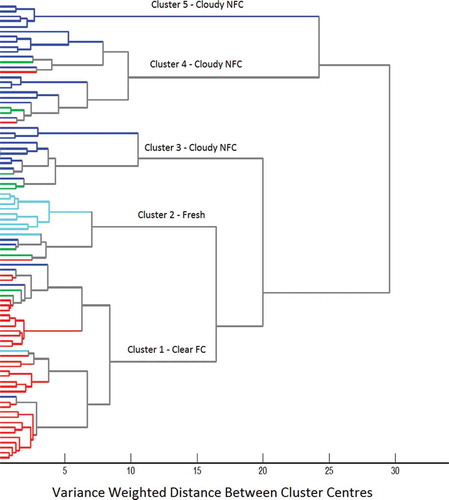
Table 4. Characteristic of the kNN classification model.
Table 5. Prediction results for the test set samples using kNN classification model.