Figures & data
Figure 1. Flow diagram of traditional manufacture of Bouhezza goat’s raw milk cheese (re-arranged by the data from Aissaoui Zitoun et al. (2011) and Aissaoui Zitoun [2014]).
![Figure 1. Flow diagram of traditional manufacture of Bouhezza goat’s raw milk cheese (re-arranged by the data from Aissaoui Zitoun et al. (2011) and Aissaoui Zitoun [2014]).](/cms/asset/16ef7c37-9fc8-4974-9773-d7b4371e9e61/ljfp_a_1222588_f0001_b.gif)
Table 1. Chemical composition (in %) and pH of traditional Algerian Bouhezza goat’milk cheese (n = 3).
Table 2. Evolution of protein fraction (Mean ± SD); total nitrogen (TN); water-soluble nitrogen (WSN/% of TN); 12% Trichloroacetic acid-soluble nitrogen (TCA-SN/% of TN) and total free amino acids (FAA) during ripening of Algerian traditional Bouhezza goat’s milk cheese (n = 3).
Figure 2. Urea-polyacrylamide gel electrophoresis (urea-PAGE) of the water-insoluble nitrogen fractions Lben and 15, 30, 45, 64, and 72 d-old Bouhezza cheese. F1, F2, or F3 refer to fabrications (trials) of Bouhezza cheese.
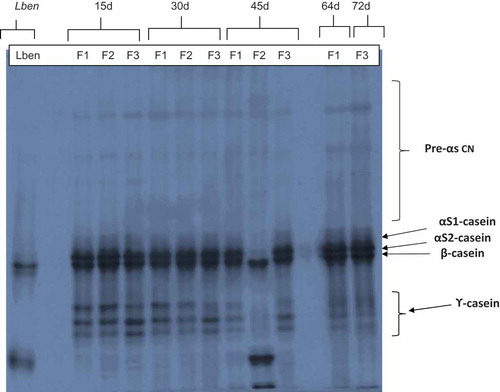
Figure 3. RP-HPLC profile of water-soluble nitrogen fraction of Bouhezza raw goat’s milk cheese during ripening. Eluted at 214 nm (arbitrary units).
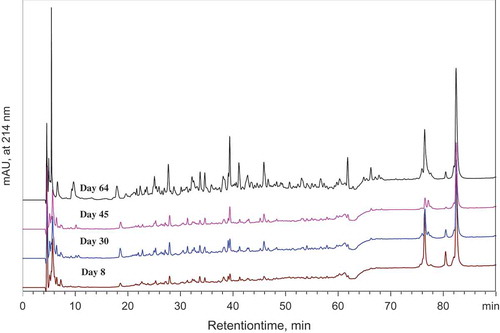
Table 3. Esters (Mean ± SD µg.L−1 for Lben and µg.Kg−1 for cheese) in Lben from goat milk and Bouhezza raw goat’s milk cheese.
Table 4. Carboxylic acids (Mean ± SD µg.L−1 for Lben and µg.Kg−1 for cheese) in Lben from goat milk and Bouhezza raw goat’s milk cheese.
Table 5. Alcohols (mean ± SD µg.L−1 for Lben and µg.Kg−1 for cheese) in Lben from goat milk and Bouhezza raw goat’s milk cheese.
Table 6. Aldehydes (mean ± SD µg.L−1 for Lben and µg.Kg−1 for cheese) in Lben from goat milk and Bouhezza raw goat’s milk cheese.
Table 7. Ketones (mean ± SD µg.L−1 for Lben and µg.Kg−1 for cheese) in Lben from goat milk and Bouhezza raw goat’s milk cheese.
Table 8. Terpenes (mean ± SD µg.L−1 for Lben and µg.Kg−1 for cheese) in Lben from goat milk and Bouhezza raw goat’s milk cheese.
Table 9. Miscellaneous (mean ± SD µg.L−1 for Lben and µg.Kg−1 for cheese) in Lben from goat milk and Bouhezza raw goat’s milk cheese.
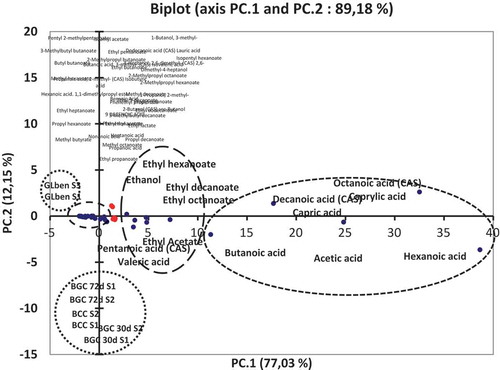
Figure 4. Score plot of the first two principal components of the volatile data from GC-MS analysis of Bouhezza raw goat’s milk cheese.