1,264
Views
4
CrossRef citations to date
0
Altmetric
Articles

A chemometric approach for the quantification of free fatty acids in cottonseed oil by Fourier transform infrared spectroscopy

, , , , , & ORCID Icon show all
Pages 1913-1920 | Received 25 Jun 2016, Accepted 08 Aug 2016, Published online: 28 Dec 2016

Figures & data

Table 1. FTIR spectral regions of cottonseed oil.

Figure 1. FTIR spectra of cottonseed oil. A: containing high FFAs; and B: containing low FFAs.

Figure 1. FTIR spectra of cottonseed oil. A: containing high FFAs; and B: containing low FFAs.

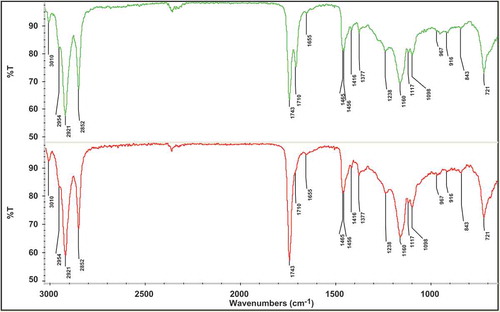
Table 2. Prediction capabilities of PLS-FTIR and PCR-FTIR measurement model for the determination of FFA.

Figure 2. Plot of actual FFAs versus predicted FFAs by FTIR A: PLS model; and B: PCR model.

Figure 2. Plot of actual FFAs versus predicted FFAs by FTIR A: PLS model; and B: PCR model.

Figure 3. Oleic acid spiked group spectra of calibration standards.

Figure 3. Oleic acid spiked group spectra of calibration standards.

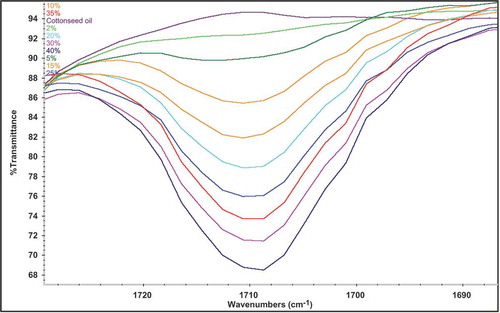
Table 3. FFAs content of cottonseed oil by titrimetric and FTIR (PLS and PCR).

Reprints and Corporate Permissions

Please note: Selecting permissions does not provide access to the full text of the article, please see our help page How do I view content?

To request a reprint or corporate permissions for this article, please click on the relevant link below:

Academic Permissions

Please note: Selecting permissions does not provide access to the full text of the article, please see our help page How do I view content?

Obtain permissions instantly via Rightslink by clicking on the button below:

If you are unable to obtain permissions via Rightslink, please complete and submit this Permissions form. For more information, please visit our Permissions help page.