Figures & data
Table 1. pH, TA, phosphate, calcium, and degree of saturation of soft drinks, energy drinks, fruit juices, and bottled drinking water.
Figure 1. Dental erosion indicating parameters of soft drinks. (a) pH, (b) TA, (c) phosphate, (d) calcium, (e) degree of saturation; error bars indicate standard deviation for (a–d).
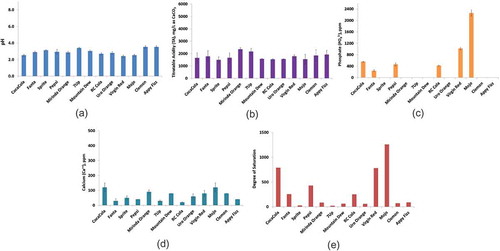
Figure 2. Dental erosion indicating parameters of energy drinks. (a) pH, (b) TA, (c) phosphate, (d) calcium, (e) degree of saturation; the low values of phosphate are shown in the in site picture of (c); error bars indicate standard deviation for (a–d).
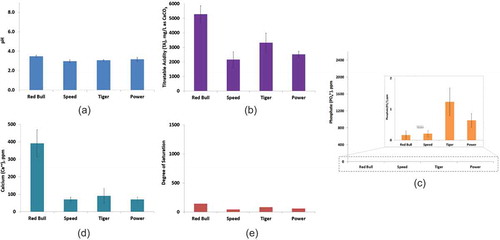
Figure 3. Dental erosion indicating parameters of fruit juices. (a) pH, (b) TA, (c) phosphate, (d) calcium, (e) degree of saturation; the low values of phosphate are shown in the in site picture of (c); error bars indicate standard deviation for (a–d).
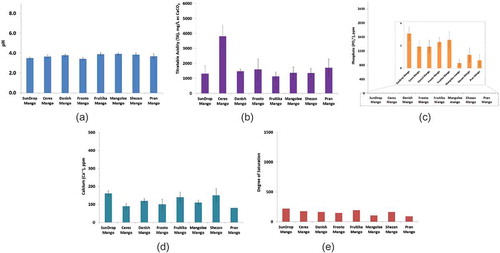
Figure 4. Dental erosion indicating parameters of bottled drinking water. (a) pH, (b) TA, (c) phosphate, (d) calcium, (e) degree of saturation; the low values of TA and phosphate contents are shown in the in site picture of (b) and (c), respectively; error bars indicate standard deviation for (a–d).
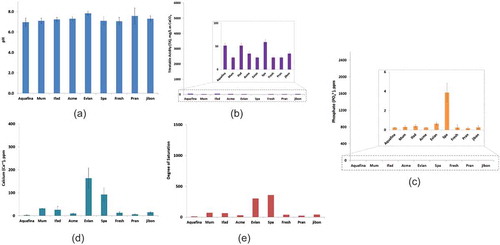
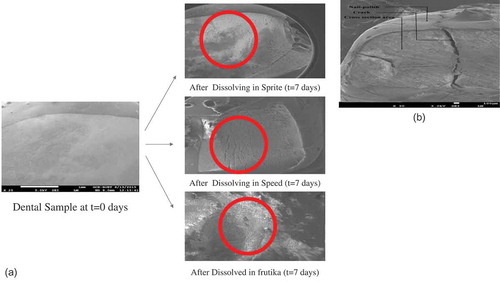
Figure 5. SEM analysis of dental erosion caused by beverages. (a) SEM images were taken before and after dissolution of dental samples in beverages (Fanta, Speed and Frutika) for 10 days; (b) SEM image of cross-section of eroded tooth sample in Sprite.