
Figures & data
Figure 1. Scanning electron microscopic images of dextran solutions at concentration of (a) 0.1875 g/ml and (b) 0.375 g/ml dextran under the voltage of 14 kV, flow rate of 1 ml/h, and the distance of 15 cm at 25°C with magnifications of 500, 1000, and 2000× from left to right.
Figure 2. SEM images of vitamin E-loaded dextran nanofibres: (a) 1.25 and (b) 1 g/ml dextran under 15 kV, and (c) 1.25 and (d) 1 g/ml dextran under 13 kV with magnifications of 500, 1000 and 2000× from left to right.
Figure 3. X-ray diffraction of dextran powder (dp) and vitamin E-loaded nanofibres with (1) 1.25 and (2) 1 g/ml dextran at 15 kV and (3) 1.25 and (4) 1 g/ml dextran at 13 kV.
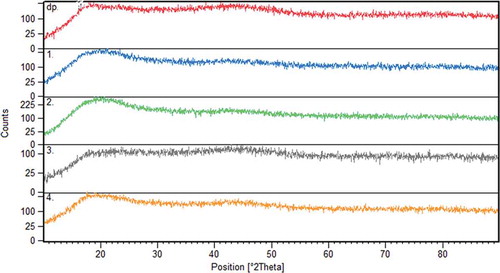
Figure 4. FTIR spectra of vitamin E-loaded nanofibres, vitamin E, and dextran powder.
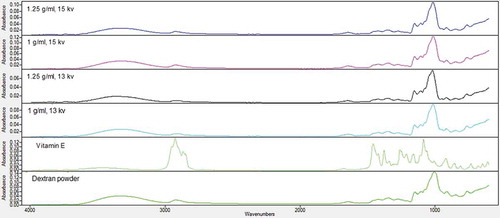
Table 1. Model parameters of vitamin E release from dextran nanofibres.
Figure 5. FTIR spectra of vitamin E-loaded nanofibres, vitamin E, and dextran powder.
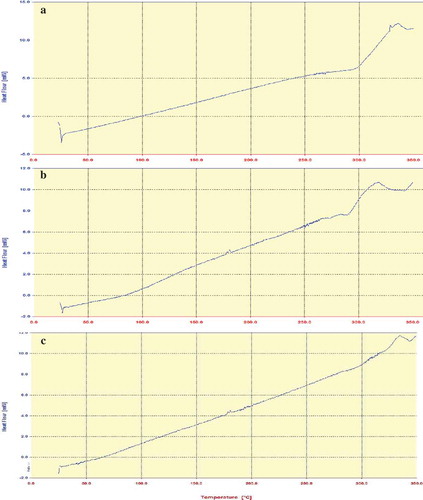
Figure 6. Release profile of vitamin E from dextran nanofibres in gastrointestinal media.
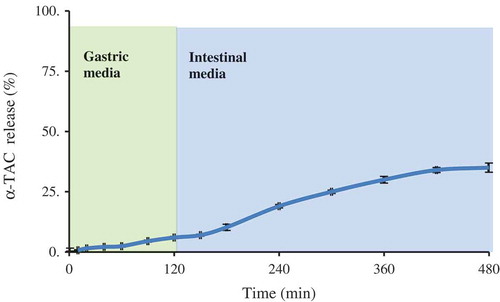
Table 2. Sensory evaluation of blank cheese, direct vitamin E fortified cheese, and vitamin E-loaded nanofibre fortified cheese.