Figures & data
Table 1. Properties of the crumb and the crust of the chicken nuggets used.
Figure 1. Determination of Poisson ratio using the uniaxial compression test.
Figure 2. Temperature profiles of nugget crumb and crust samples frozen at different temperatures.
Figure 3. Mean Poisson’s ratios of nugget crumb and crust during freezing at different temperatures.
Figure 4. Mean values of Young’s modulus for (a) nugget crumb, and (b) nugget crust during freezing at different temperatures.
Figure 5. Effect of the ice fraction and temperature on the Young’s modulus of nugget crumb (: Amounts of Young’s modulus above the freezing point;: amounts of Young’s modulus below the freezing point;: amounts of extrapolated Young’s modulus;: fitted values of Young’s modulus by second-order polynomial equation).
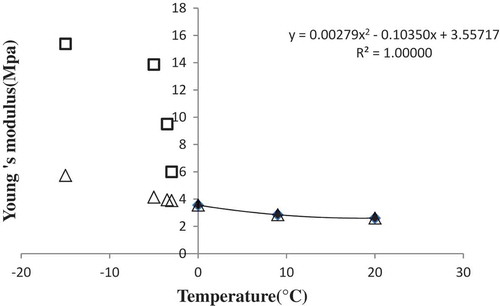
Figure 6. Comparison of theoretical and experimental values of Young’s modulus during freezing of nugget crumb.