
Figures & data
Figure 1. The germinated black soybean sprouts.
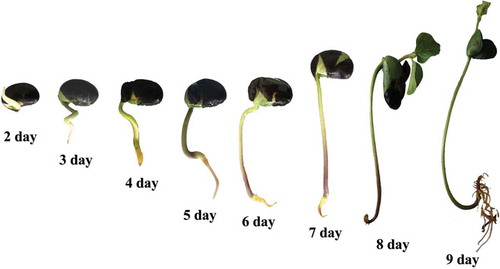
Table 1. Identification of the chemical constituents from black soybean sprouts by UHPLC−Q-TOF-MS.
Figure 2. The representative total ion chromatogram and extract ion chromatograms for 23 components.
Figure 2. (Continued).
Table 2. Calibration curves, LOD, and LOQ data of six investigated compounds.
Table 3. Intra-, inter-day precision, stability, repeatability, and recovery of investigated compounds.
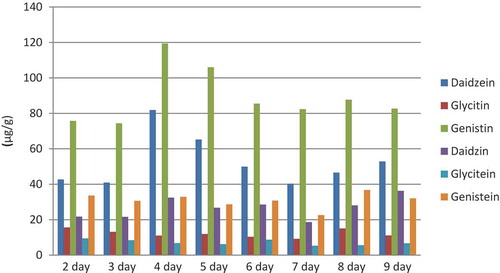
Figure 3. Content of six compounds in black soybean sprouts (μg/g).
Supplemental material