
Figures & data
Table 1. Description of the samples collected in this study.
Table 2. Validation parameters of ICP-MS analytical method.
Table 3. Trace elements in 52 samples of equine meat with statistical descriptors: range, average, and standard deviation (SD).
Figure 1. A comparison of Ca, Fe, Zn, and Cu levels among meats of different origin.
Figure 2. Element-by-element comparison between meats from equine of different genders.
Figure 3. Element-by-element comparison between equine meats from different breeding geolocations.
Figure 4. Trace element accumulation.
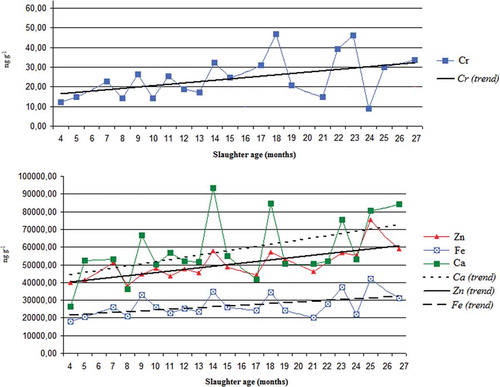
Figure 5. Correlation between levels of Zn/Fe (A) and Fe/Ca (B).
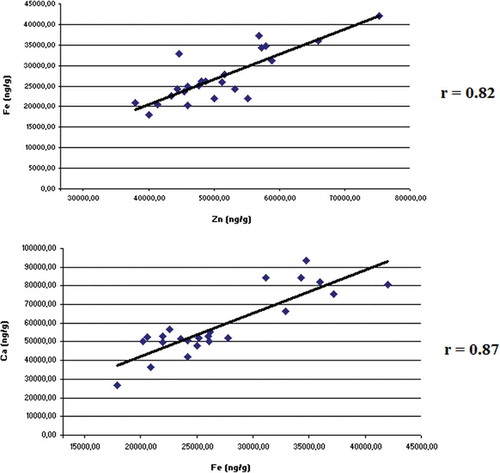
Figure 6. Comparison of equine and bovine meats – principal component analysis: 22 trace elements (A); 8 significant trace elements (p < 0.005) (B).
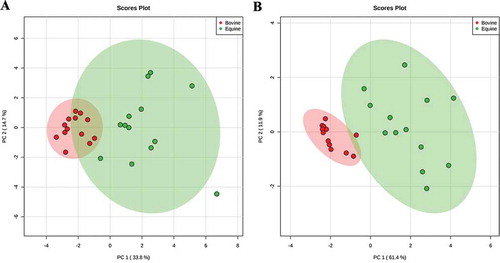
Table 4. Trace elements in 52 samples of equine liver with statistical descriptors: range, average, and standard deviation (SD).