Figures & data
Table 1. Determination of MIC and MBC values of SBE against selected pathogenic microorganisms.
Figure 1. Accumulation of ROS following treatment with SBE was detected by flow cytometric analysis using H2DCFDA.
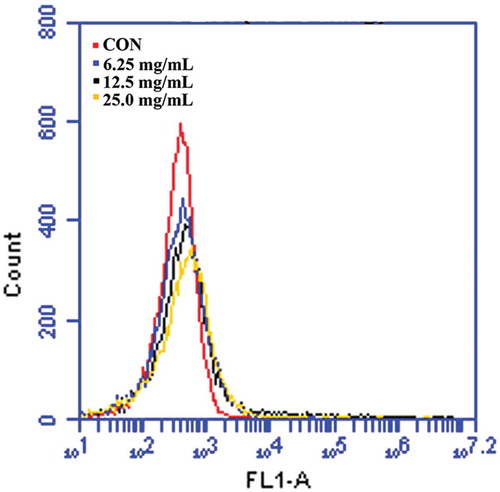
Figure 2. Analysis of membrane depolarization in E. coli following treatment with SBE. (A, B) Flow cytometric analysis of membrane depolarization using Mitochondrial Membrane Potential/Annexin V apoptosis kit. (C) Membrane potential was determined by flow cytometric analysis using Rhodamine 123 staining.
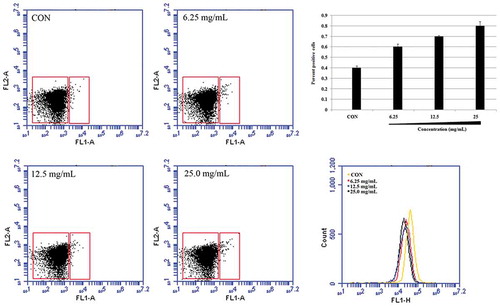
Figure 3. Caspase-like response was detected by flow cytometric analysis using FITC-VAS-FMK
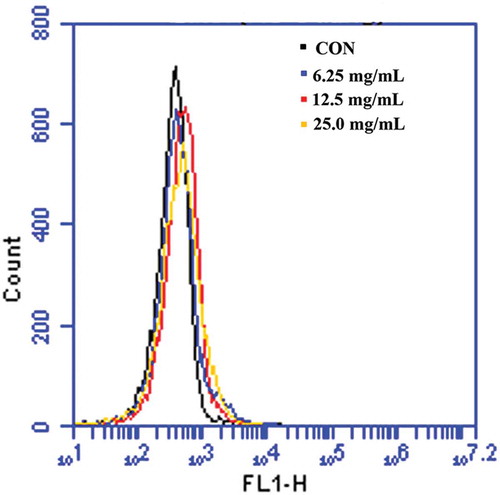
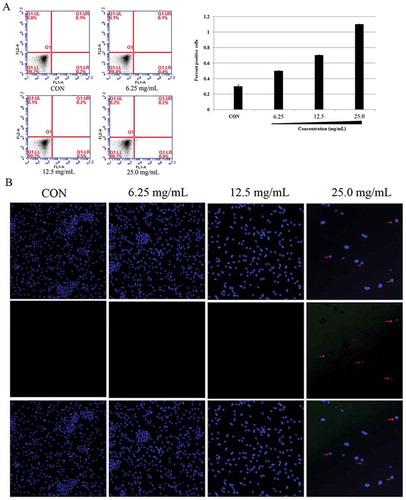
Figure 4. PS exposure on the membrane outer leaflet was observed by Annexin V/PI double staining.
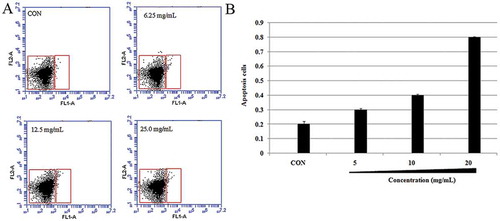
Figure 5. Analysis of DNA damage E. coli following treatment with SBE. (A) Flow cytometric analysis of DNA structure using Hoechst 33342/PI double staining. (B) Fluorescent microscopy analysis of DNA fragmentation using TUNEL.