Figures & data
Figure 1. The procedure designed for predicting the chemical attributes of HZB by computer vision system and artificial neural networks.
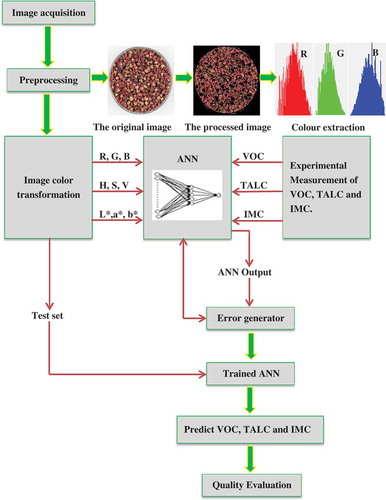
Table 1. Colour parameters, VOC, and IMC of HZB samples.
Table 2. Result of method validation of colour measurement (CIE L*, a*, and b*) with RSD for Grade I, Grade II, and Grade III, respectively.
Table 3. Result of method validation of TALC measurement.
Table 4. The relationships between HZB colour and the content of TALC, VOC, and IMC are presented in the correlation matrix (presenting Pearson correlation coefficients).
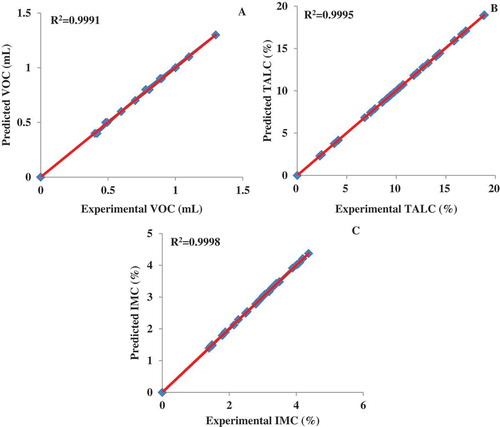
Figure 2. Correlations between the predicted and experimental values of VOC (A), TALC (B), and IMC (C) after trained.