
Figures & data
Figure 1. The side and rear view of the RF heating system (a) and the interior view of the RF heating system (b) showing I: reflex signal conditioner; II: temperature controller; III: data acquisition device; IV: data acquisition software; V: electrodes; VI: canola seeds; VII: fibre optic temperature sensors.[Citation20]
![Figure 1. The side and rear view of the RF heating system (a) and the interior view of the RF heating system (b) showing I: reflex signal conditioner; II: temperature controller; III: data acquisition device; IV: data acquisition software; V: electrodes; VI: canola seeds; VII: fibre optic temperature sensors.[Citation20]](/cms/asset/0d1306ae-719b-40cd-b11e-8afdcb661940/ljfp_a_1272609_f0001_oc.jpg)
Figure 2. The location of the hottest spot of the small -volume samples (a), and the large-volume samples at MCs of 5% and 7% (b), and 9% and 11% (c).[Citation20]
![Figure 2. The location of the hottest spot of the small -volume samples (a), and the large-volume samples at MCs of 5% and 7% (b), and 9% and 11% (c).[Citation20]](/cms/asset/42203d3d-58bf-471a-8ce2-62d4e35eea54/ljfp_a_1272609_f0002_b.gif)
Table 1. The regression models for the temperature of the canola seeds as a function of the RF exposure time (s) at different seed MCs and volumes during the RF heating.
Figure 3. The temperature histories of the small- (a) and large- (b) volume samples at the indicated MCs of the seeds during RF heating. (Note: The experimental data points are connected with simple straight lines for visual presentation.)
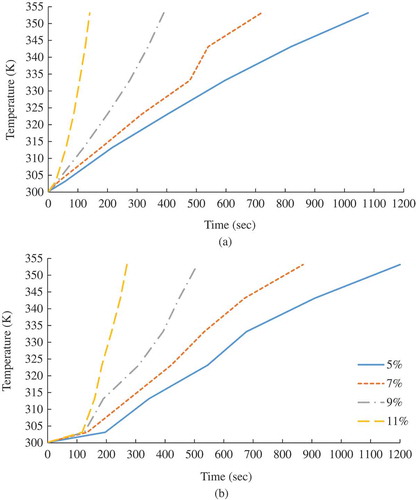
Figure 4. The survival rates (%) of the adult T. castaneum infesting (a) the small- and (b) large-volume samples at different seed MCs during the RF heating. (Note: The experimental data points are connected with simple straight lines for visual presentation.)
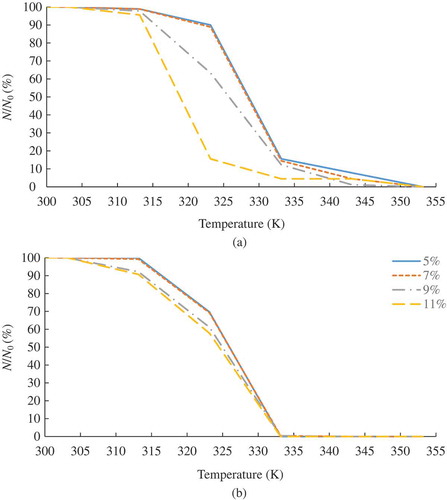
Table 2. The performance of the kinetic model (Eq. 5) in predicting the mortalities of the adult T. castaneum during the RF heating.
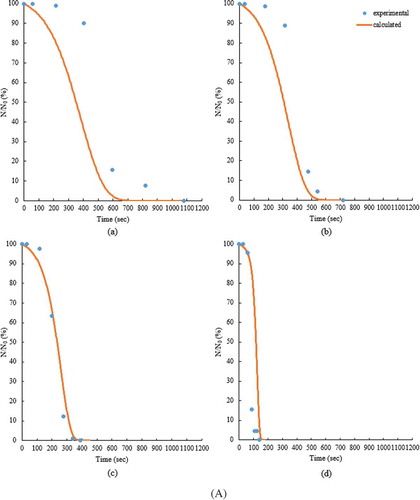
Figure 5. The survival rates (%) of the adult T. castaneum infesting the small (A) and the large (B) volume samples at 5% (a), 7% (b), 9% (c), and 11% (d) seed MCs during the RF heating.
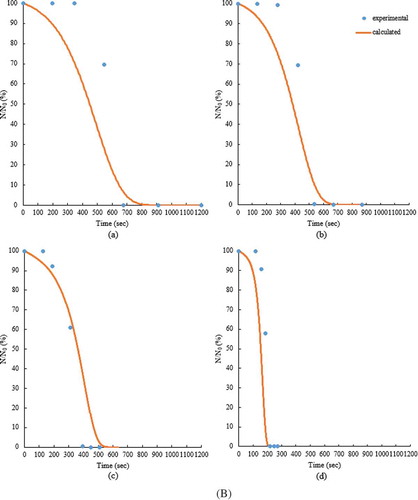
Table 3. The RF exposure times (s) to achieve 100% mortality and the LTs (s) determined from the experimental and simulated data for the adult T. castaneum at the indicated seed MCs and volumes.