Figures & data
Figure 1. Effect of heat treatment on exposed sulfhydryl content (µM/gr of protein) of OEWS at pH 7.5 (white bars) and pH 9 (grey bars). For each individual pH, means with the same letter are not significantly different at p = 0.05.
Figure 2. Effect of heat treatment on SDS-PAGE patterns of OEWS under non-reducing conditions (without 2-ME) at pH 9 (a) and pH 7.5 (b).
Figure 3. Effect of heat treatment on SDS-PAGE patterns of OEWS under reducing conditions (with 2-ME) at pH 9 (a) and pH 7.5 (b).
Figure 4. Effect of heat treatment on Native-PAGE patterns of OEWS at pH 9 (a) and pH 7.5 (b).
Figure 5. Effect of heat treatment on turbidity of OEWS at pH 7.5 (empty symbols) and pH 9 (full symbols). For each individual pH, means with the same letter are not significantly different at p = 0.05.
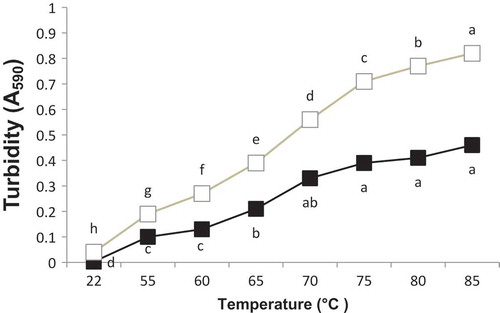
Table 1. Foaming properties (average ± standard deviation) of OEWS after heat treatment.
Figure 6. Effect of heat treatment on foaming capacity of OEWS at pH 7.5 (empty symbols) and pH 9 (full symbols). For each individual pH, means with the same letter are not significantly different at p = 0.05.
Figure 7. Effect of heat treatment on foam density (♦) and foam stability (▲) of OEWS at pH 7.5 (empty symbols) and pH 9 (full symbols). For each individual pH, means with the same letter are not significantly different at p = 0.05.