Figures & data
Figure 1. Method for encapsulation of TA herb extract.
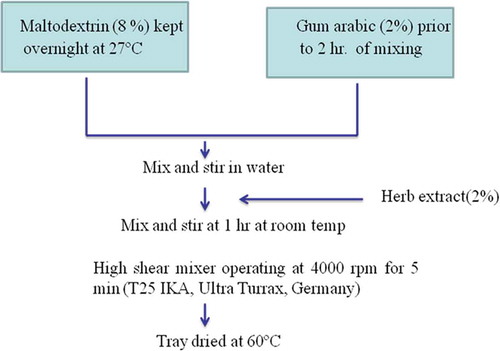
Table 1. Contents of total phenolics (gallic acid equivalent), tannins, and flavonoids (catechin equivalents) in ethanolic extract of TA.
Figure 2. Reducing potential TA extract using the FRAP method. Data are presented as means ± SEM (n = 3). Means in each bar with different superscripts (a, b, c, d, e) were significantly different (p < 0.05) from each other. Statistical comparisons were made between samples using ANOVA single factor.
Figure 3. DPPH radical scavenging activity of various concentrations of TA extracts. Data are presented as means ± SEM (n = 3). Means in each bar with different superscripts (a, b, c, d and e) were significantly different (p < 0.05) from each other. Statistical comparisons were made between samples using ANOVA single factor.
Figure 4. Light microscopic images of (a) MDG microcapsule and (b) MDGA microcapsule containing TA extract.
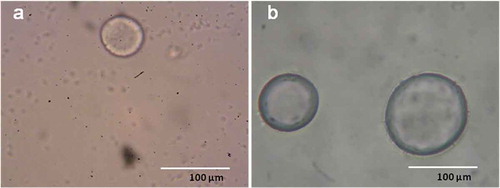
Figure 5. Encapsulation efficiency of TA microcapsules. Data are presented as means ± SEM (n = 3). Means in each bar with different superscripts (a, b) were significantly different (p < 0.05) from each other. Statistical comparisons were made between samples using ANOVA single factor.
Figure 6. In vitro release profile of polyphenolic content from TA microcapsule. Data are presented as means ± SEM (n = 3). Means in each bar with different superscripts (a, b) were significantly different (p < 0.05) between the samples. Means in each bar with different superscripts (A, B, C, D) were significantly different (p < 0.05) among the samples. Statistical comparisons were made between samples using ANOVA single factor.