
Figures & data
Figure 1. General structure of glucosinolates. ‘R’ represents the side chain.
Figure 2. Overview of spectrophotometric method for estimating total glucosinolate content in rapeseed-mustard seed meal.
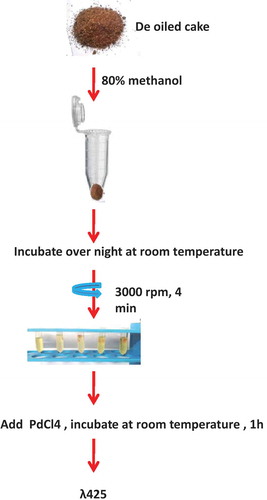
Table 1. Comparison of total glucosinolate content obtained by HPLC and spectrophotometric method after using the predicted formula.
Figure 3. Regression models using Ordinary Least Square techniques, total glucosinolates (µmol/g) was assumed to depend on only one predictor variable A425, where A425 is the absorbance at 425 nm. It was seen that total glucosinolates (µmol/g) was statistically significantly dependent on A425. Further, the predicted value and observed value of total glucosinolates (µmol/g) was almost overlapping graphically, which validated the relationship obtained using regression analysis.
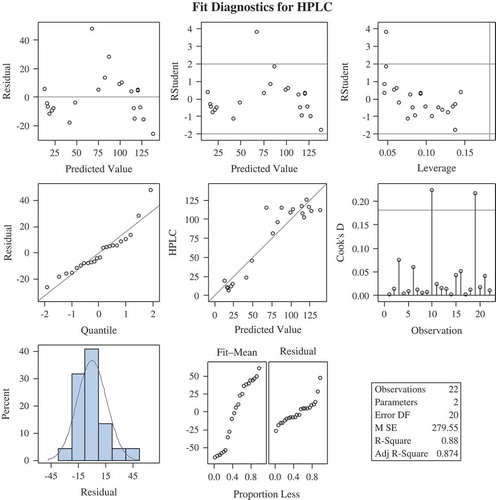
Figure 4. Regression models for prediction formula were obtained by using the HPLC data and their corresponding wet lab (spectrophotometric) data taken at absorbance 425.
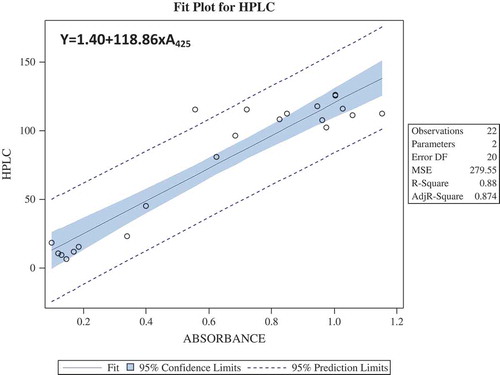
Figure 5. (a) Graphical representation of estimated total glucosinolates using HPLC and spectrophotometric method after calculating with the predicted formula y = 1.40 + 118.86 × A425. (b) Regression analysis between total glucosinolate content obtained by HPLC and spectrophotometric methods showed a strong correlation of 0.942.
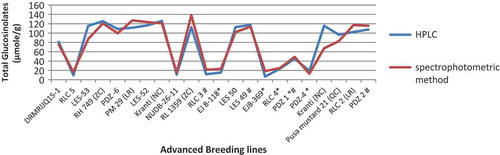
Table 2. Predicted formula was further confirmed and compared with HPLC data.