Figures & data
Table 1. Proximate composition, amylose content, swelling power, and solubility of starches from different oat cultivars.
Figure 1. Transmittance (Abs.) of starches from different oat cultivars.
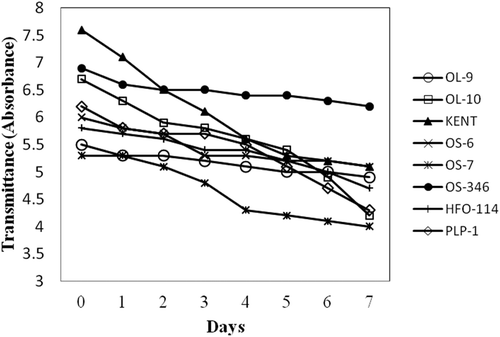
Figure 2. Freeze thaw stability of starches from different oat cultivars.
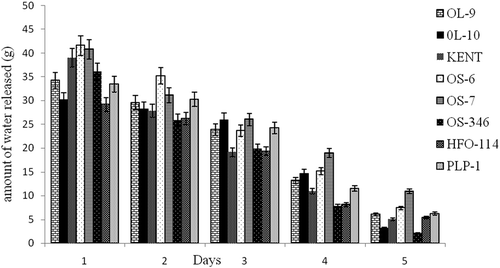
Figure 3. X-ray diffraction of starches from different oat cultivars at 2θ (4–30°).
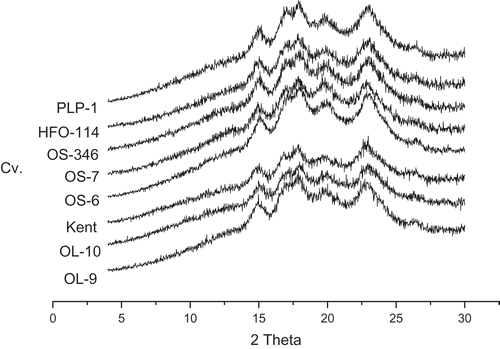
Figure 4. Scanning electron micrograph of starches from different oat cultivars: (A) OL-9, (B) OL-10, (C) Kent, (D) OS-6, (E) OS-7, (F) OS-346, (G) HFO-114, and (H) PLP-1.
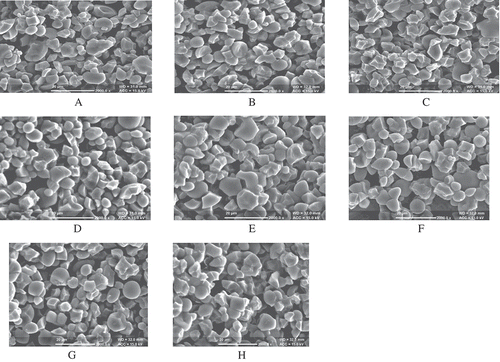
Table 2. Herschel-Bulkley model parameters for starch pastes from different oat cultivars.
Figure 5. (a) Flow curves of starch pastes (10%) from different oat cultivars. (b) Changes in storage modulus (G′) and changes in Loss modulus (G′′) of 15% oat starch suspensions during heating: (A) OL-9 (B) OL-10 (C) Kent (D) OS-6 (E) OS-7 (F) OS-346 (G) HFO-114 (H) PLP-1. (c) Changes in storage modulus (G′) and changes in Loss modulus (G′′) of 15% oat starch suspensions during a frequency sweep (0.1–100 rad/s at 25ºC): (A) OL-9 (B) OL-10 (C) Kent (D) OS-6 (E) OS-7 (F) OS-346 (G) HFO-114 (H) PLP-1.
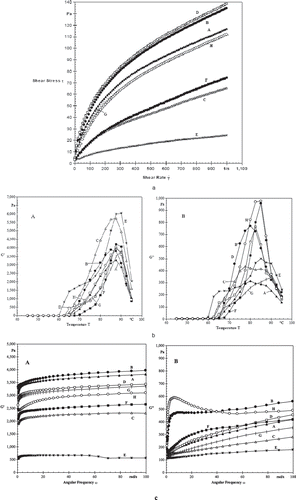
Table 3. Dynamic rheological properties of starches from different oat cultivars.
Table 4. Storage modulus (G’), loss modulus (G’’), complex viscosity (ƞ*), and tan δ for oat starch pastes at 6.28 rad/s at 25°C.
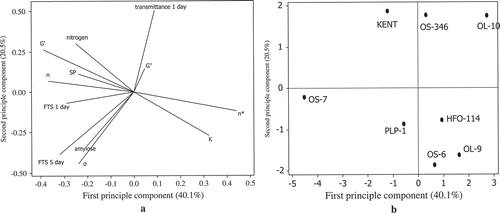
Figure 6. (a) Principal component analysis: loading plot of first principal component (PC1) and second principal component (PC2) describing the variation among measured properties of starches from different oat cultivars. (b) Principal component analysis: score plot of PC1 and PC2 describing the overall variation among the properties of starches from different oat cultivars.