Figures & data
Figure 1. The schematic diagram of Maillard reaction of casein with dextran and possible structure of CD micelles.
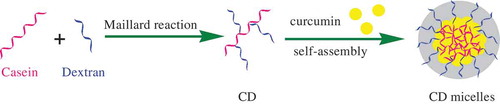
Figure 2. Variation of the pyrene polarity ratio I1/I3 with casein concentration Ccasein at pH 7.
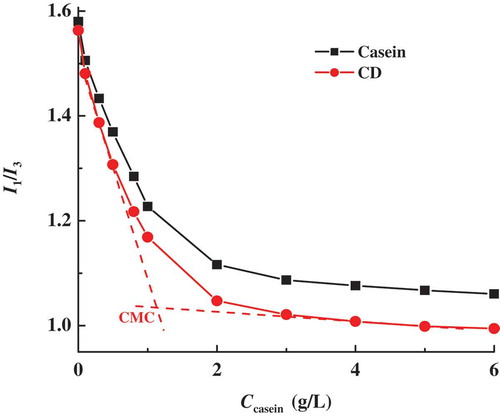
Figure 3. Turbidity curves of casein and casein–dextran conjugate samples as a function of pH.
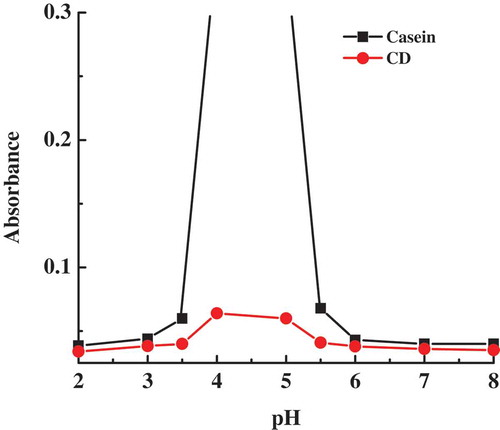
Figure 4. Fluorescence spectra of casein in casein micelles and casein–dextran conjugate micelles at pH 7 (A). Variations of fluorescence spectra of casein in casein micelles (B) and casein–dextran conjugate micelles (C) as a function of curcumin concentration at pH 7. Spectra a–k correspond to 0, 1, 2, 3, 4, 5, 6, 7, 8, 9, and 10 μM curcumin, respectively. (Insets) Linear plots of for the determination of binding constants of curcumin with casein and casein-dextran conjugate micelles.
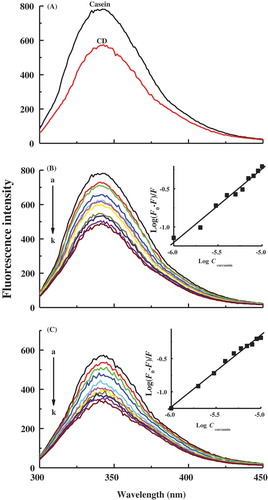
Figure 5. Fluorescence spectra of curcumin in water, casein micelles, and casein–dextran conjugate micelles at pH 7.
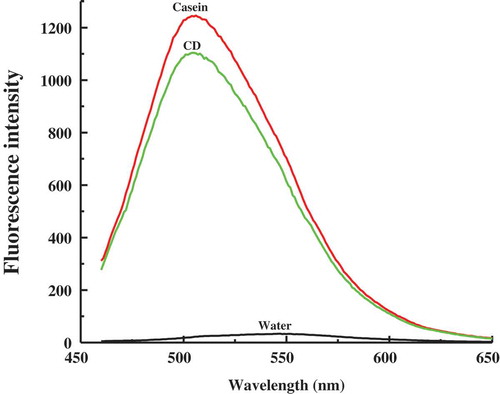
Figure 6. The pseudo-first-order plots for the degradation of curcumin in water, casein micelles, and casein–dextran conjugate micelles at pH 7. The data are normalized to a value of 100 at zero time. Points represent the experimental data and the solid lines were drawn using pseudo-first-order kinetic equation.
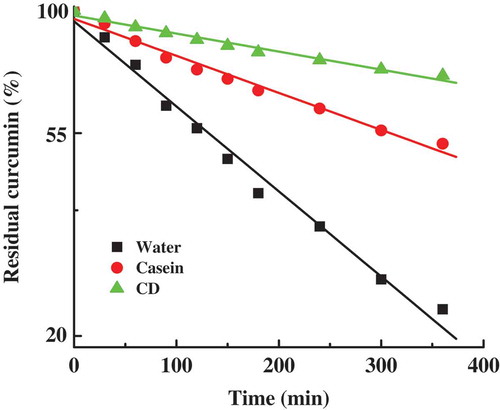
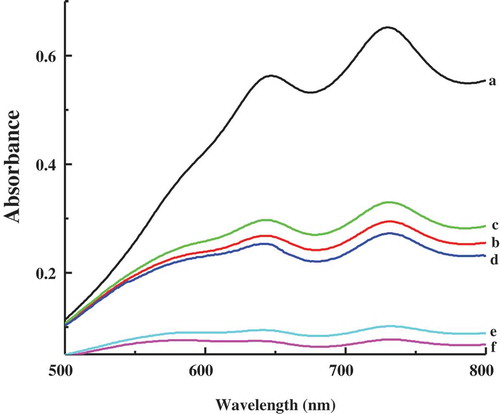
Figure 7. Absorption spectra of ABTS+ in different samples. (a) ABTS+ alone; (b) ABTS+ with casein micelles; (c) ABTS+ with casein–dextran conjugate micelles; (d) ABTS+ with curcumin; (e) ABTS+ with curcumin and casein micelles; (f) ABTS+ with curcumin and casein–dextran conjugate micelles.