Figures & data
Table 1. Design of decolouring experimental program.
Table 2. The fat content and skim rate of NFS, NFS1, NFS2, and NFS3.
Table 3. The yield and Hyp content of collagen extracted from the different pretreatment technics.
Table 4. Proximate analyses of NFS and PFS.
Figure 1. SDS-PAGE pattern of collagen by different pretreatments (A1–A4: pH 8, 9, 10, 11; B1–B4: concentration of H2O2 0.5%, 1%, 2%, 4%).
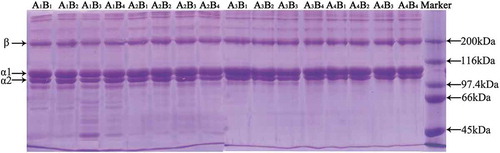
Figure 2. Tissue images of NFS and PFS dyed by heamatoxylin-eosin method at a magnification of 100 (a1, a2 and c1, c2: transverse cutting figure of NFS and PFS, respectively; b1, b2 and d1, d2: longitudinal cutting figure of NFS and PFS, respectively).
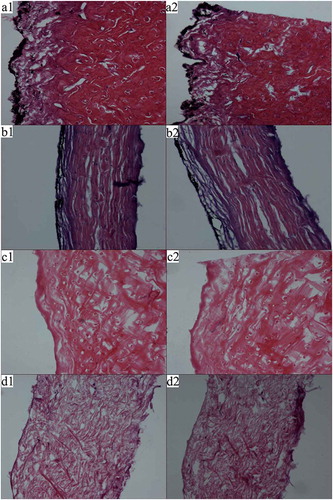
Table 5. Amino acid composition of collagens (residues/1000 residues).
Figure 3. Ultraviolet spectra of collagen extracted from Southern catfish skin (a) and calf skin (b).
Figure 4. FTIR spectra of collagen extracted from Southern catfish skin (a) and calf skin (b).
Figure 5. DSC thermograms of FC (a) and CC (b) solutions.