Figures & data
Table 1. Effects of HHP on chlorophyll content of PS II extract solution*.
Figure 1. Effects of HHP on soluble protein content of PS II extract solution. Different letters (a–c) in the column means significant difference at 0.05 level (p < 0.05).
Figure 2. Effects of HHP on protein peptide components of PS II extract solution. The loaded chlorophyll concentrations of control, thermal, 100, 250, 450, and 500 MPa were 0.497, 0.357, 0.467, 0.472, 0.455, and 0.449 mg mL–Citation1, respectively.
Figure 3. Effects of HHP on chlorophyll absorption spectra of PS II extract solution. (A) Chlorophyll absorption spectra; (B) the fourth derivative of chlorophylls absorption spectra; (C) Gaussian deconvolution of chlorophyll absorption spectra. The dark and the green upper line of the figure indicate the real spectra and the add-up of the resolved Gaussian spectra, respectively. The green line below the spectra is the residue of the deconvolution; (D) Gaussian components of chlorophyll absorption spectra.
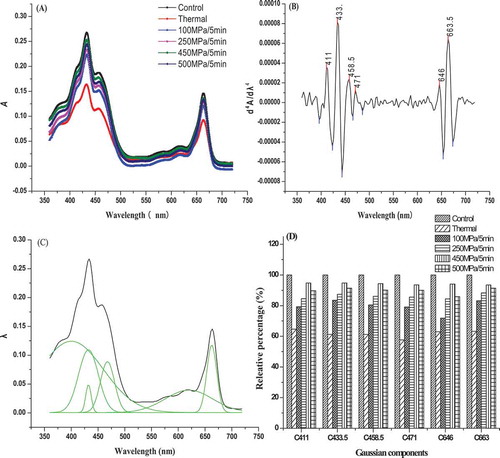
Figure 4. Effects of HHP on chlorophylls emission fluorescence spectra of PS II extract solution. (A) Chlorophyll a emission fluorescence spectra; (B) chlorophyll b emission fluorescence spectra; (C) the fourth derivative of chlorophyll a emission fluorescence spectra; (D) the fourth derivative of chlorophyll b emission fluorescence spectra; (E) Gaussian deconvolution of chlorophyll a emission fluorescence spectra. The dark and the green upper line of the figure indicate the real spectra and the add-up of the resolved Gaussian spectra, respectively. The green line below the spectra is the residue of the deconvolution; (F) Gaussian deconvolution of chlorophyll b emission fluorescence spectra. The dark and the green upper line of the figure indicate the real spectra and the add-up of the resolved Gaussian spectra, respectively. The green line below the spectra is the residue of the deconvolution; (G) Gaussian components of chlorophyll a emission fluorescence spectra; (H) Gaussian components of chlorophyll b emission fluorescence spectra.
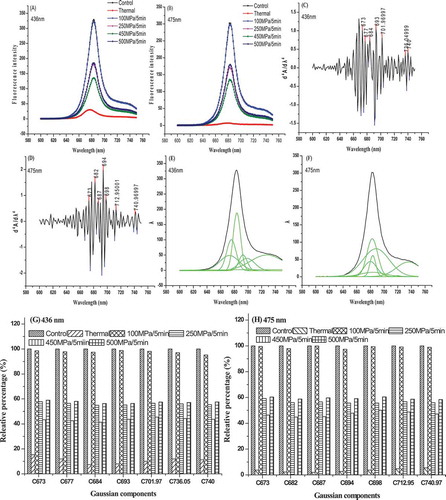
Figure 5. Effects of HHP on chlorophyll excitation fluorescence spectra of PS II extract solution at its maximum emission wavelength (λem = 680 nm).
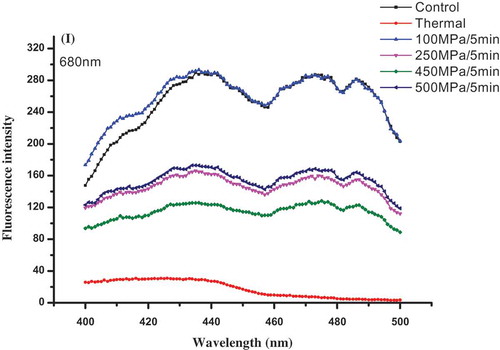
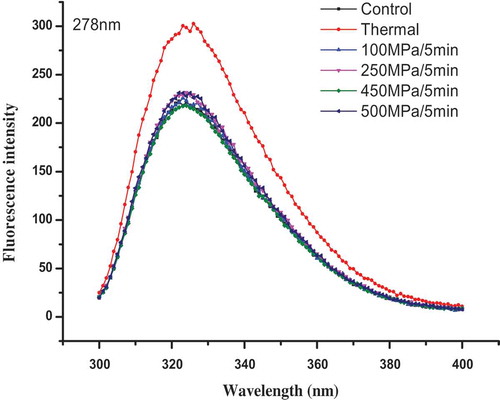
Figure 6. Effects of HHP on protein fluorescence spectra of PS II extract solution at its maximum excitation wavelength (λex = 278 nm).