Figures & data
Figure 1. Process of Chinese rice winemaking.
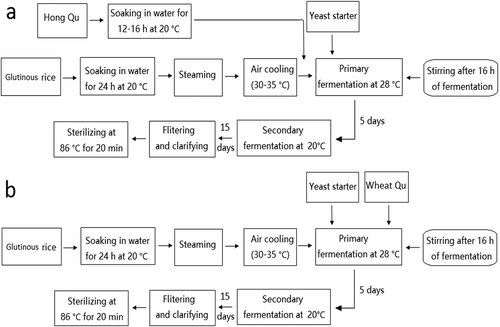
Figure 2. Results of the oenological property in HQW and WQW during different brewing stages.
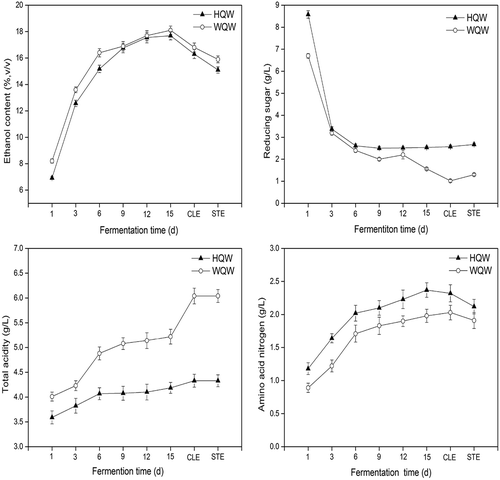
Table 1. Identification and relative contents of volatile compounds during different brewing stages of HQW and WQW analysed by SPME-GC-MS. (n = 3).
Figure 3. Changes of alcohols (a), aldehydes (b), short-chain FAEE (c), middle-chain FAEE, (d) and long-chain FAEE (e) of HQW and WQW during different brewing stages. HQW and WQW during different brewing stages (n = 3, * 0.01<p < 0.05, ** p < 0.01).
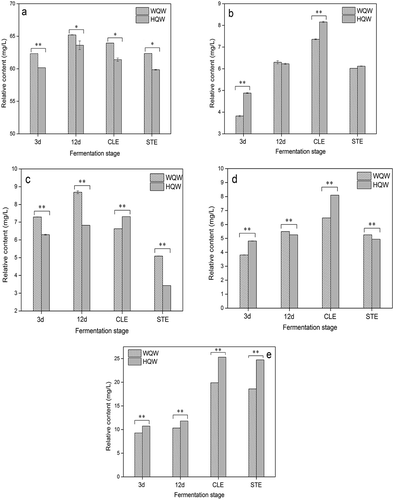
Figure 4. Variables plot for 40 volatile compounds (a) and scores (b) for the different brewing stages of HQW by PCA.
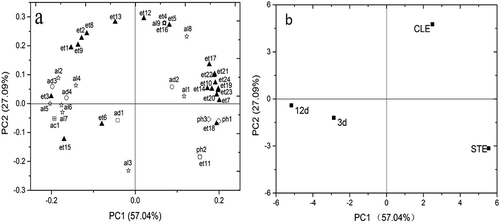
Figure 5. Variables plot for 35 volatile compounds (a) and scores (b) for the different brewing stages of WQW by PCA.
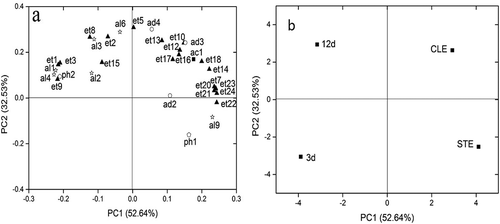
Figure 6. Sensory profile of organoleptic attributes for HQW and WQW.
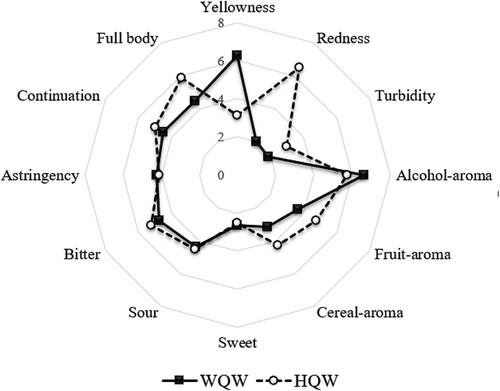
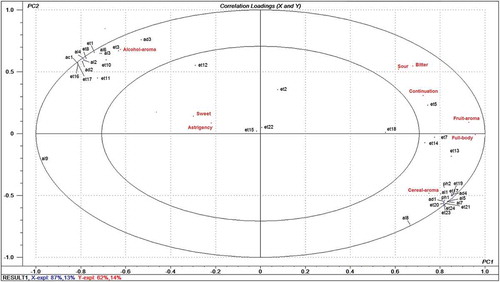
Figure 7. PLS2 regression correlation loading plot for the nine sensory attributes of the Chinese rice wine samples after sterilization and the volatile compounds identified by GC-MS.