Figures & data
Figure 1. Changes in sensory scores (A) and TVC (B) of crucian carp fillets stored at T1 (4°C) and T2 (−3°C) (TVC: total viable counts).
Table 1. Changes in biogenic amines content of crucian carp fillets stored at 4°C (CS) and −3°C (PFS).
Figure 2. Changes in different microorganism groups of crucian carp fillets during storage at 4°C (A) and −3°C (B) (TVC: total viable counts; CFC: counts of Pseudomonas.; AMB: counts of Aeromonas; H2S: counts of H2S-producing bacteria).
Table 2. Regression correlation coefficients between biogenic amines and microbial flora of crucian carp fillets stored at 4°C (CS) and −3°C (PFS).
Table 3. Comparison of phylotype coverage and alpha diversity estimation of the 16S rRNA gene libraries by sequencing on an IlluminaHiSeq2500 platform in crucian carp fillets stored at 4°C (CS) and −3°C (PFS).
Figure 3. Rarefaction curve of microbiota in crucian carp fillets stored at 4°C (CS) and −3°C (PFS).
Figure 4. Relative abundance of microbiota based on phylum level (A), family level (B), and genus level (C) in crucian carp fillets stored at 4°C (CS) and −3°C (PFS).
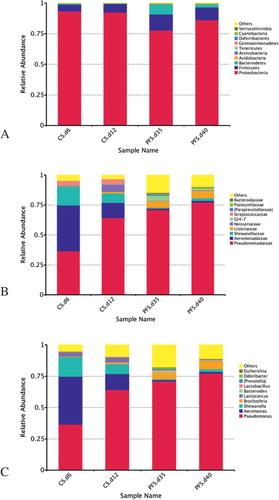
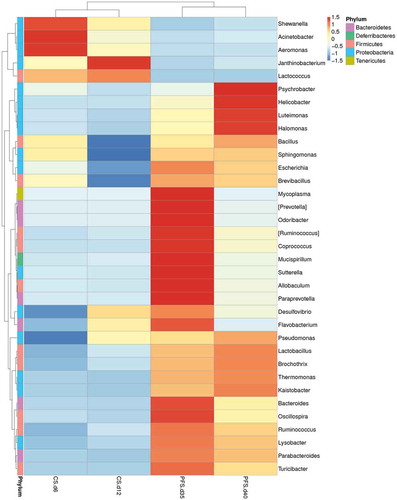
Figure 5. Relative abundance of microbiota at the genus level. Rows in the heat-map represent different genus-level phylotypes, while columns represent different crucian carp samples. The color intensity is proportional to the abundance of OTUs in each row (CS: chilled storage; PFS: partial freezing storage).