Figures & data
Table 1. Mean concentration (μg/kg) of volatile compounds detected in three Longjing tea samples.
Figure 1. (a) Five fibers, coated with 65 μm PDMS/DVB, 80 μm PA, 100 μm PDMS, 75 μm CAR/PDMS, and 50/30 μm CAR-PDMS-DVB, were assessed for the extraction of the aroma compounds. (b) Six different extraction times were evaluated in the experiment.
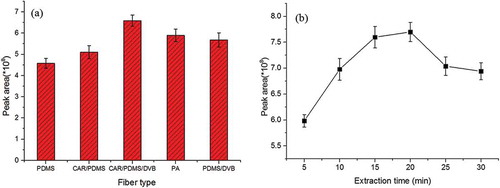
Figure 2. Total ion chromatogram (TIC) of three Longjing tea samples. The numbers (1–53) in the peak refer to the identified aroma compounds in .
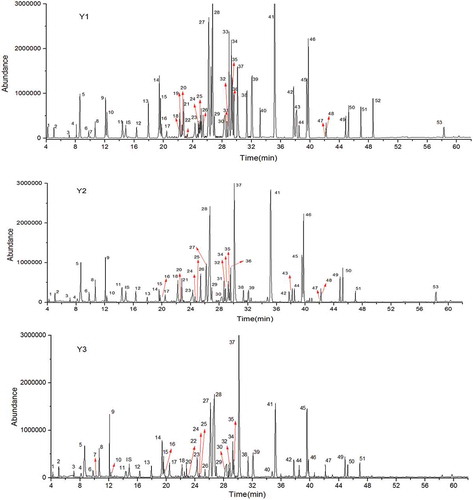
Table 2. GC-O and OAV of identified aroma-active compounds in Longjing tea samples.
Table 3. Models consisting aroma compounds with AI > 4 and OAV > 10.
Figure 3. Radar plot of electronic nose analysis data for the original odor concentrates of three Longjing tea samples and different aroma synthetic solutions based on data from gas chromatography–olfactometry (GC-O) and odor activity value (OAV) as well as the value corresponding to sensors between each aroma recombination model and the original model.
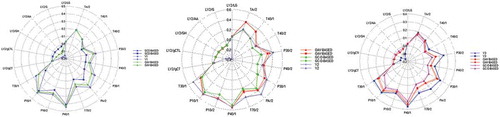
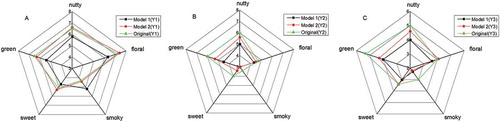
Figure 4. Aroma profiles of three Longjing tea samples and different aroma synthetic solutions based on data from GC-O (model 1) and OAV (model 2).