Figures & data
Figure 1. Purification and profiles of PPO from Penaeus vannamei. (A) Ammonium sulphate precipitation. (B) DEAE-Sepharose fast flow anion exchange chromatography. (C) Gel filtration chromatography on Sephadex G-100. (D) SDS–PAGE, M: Standard protein markers; lane 1: Purified PPO. (E) Native-PAGE, M: Native-markers; lane 1: Purified PPO stained with Coomassie brilliant R-250; lane 2: Purified PPO actively stained with L-DOPA.
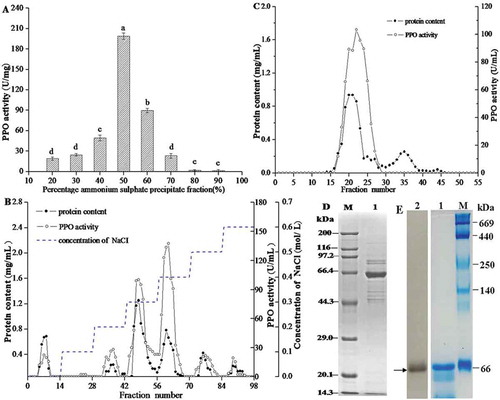
Table 1. Purification of polyphenoloxidase from Penaeus vannamei using L-DOPA as the substrate
Figure 2. Effects of pH (A) and temperature (B) on the PPO activity of Penaeus vannamei.
Figure 3. The Km value was determined by using L-DOPA as substrate. According to the Lineweaver–Burk model, the Km was calculated to be 2.5 mM.
Figure 4. Effects of heat treatments on residual activity (A) and DSC curve (B) of purified PPO from Penaeus vannamei.
Table 2. Inactivation parameters of Penaeus vannamei PPO
Figure 5. Effects of thermal treatments on the tertiary structure of purified PPO. (A) Changes in the intrinsic fluorescence spectra of PPO by thermal treatments. Labels 1–6 indicate native, 40, 50, 60, 70, and 80°C, respectively. (B) The maximum wavelength of PPO intrinsic fluorescence at different temperatures.
Figure 6. FTIR spectra of purified PPO during the thermal treatments from 40 to 80°C for 10 min.
Table 3. Secondary structure change (%) of PPO obtained by curve-fitting during thermal treatment
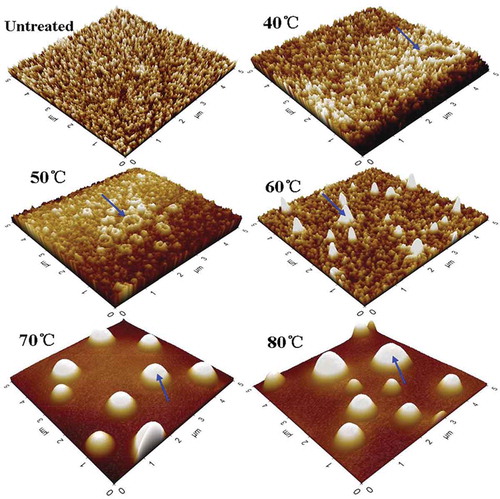
Figure 7. AFM images of PPO during the thermal treatments from 40 to 80°C for 10 min.