Figures & data
Figure 1. ATR-FTIR spectra of (a) palm kernel products and stearin, (b) palm fruit products and olein.
Table 2. Main absorption bands in the ATR–FTIR spectra of crude and refined oils and other products obtained from Elaeis guineensis (all wavenumbers are expressed in cm−1).
Table 3. High-temperature DSC thermal effects peaks (°C) for crude and refined oils from Elaeis guineensis. Palm kernel cake and palmitic acid were included for comparison purposes. Means (±SD) of triplicate analyses.
Table 4. DTA thermal effects peaks (°C) for crude and refined oils from Elaeis guineensis. Palm kernel cake and palmitic acid were included for comparison purposes. Means (±SD) of triplicate analyses.
Figure 2. TG/DTG and high-temperature DSC curves for crude (top) and refined (bottom) palm kernel oils.
Figure 3. TG/DTG and high-temperature DSC curves for crude (top) and refined (bottom) palm pulp oils.
Figure 4. TG/DTG and high-temperature DSC curves for palm olein and stearin.
Figure 5. DTA curves for all the E. guineensis products under study.
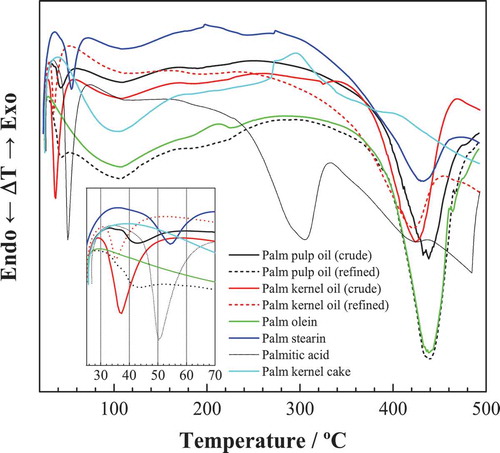
Table 5. Temperature of the peaks of triglyceride standard on DSC curves.[Citation15]
Table 6. TG curves: decomposition peaks for crude and refined oils from Elaeis guineensis. Maximum decomposition rate temperatures (in °C) were estimated from the DTG peaks for the pyrolysis of the respective products. Means (±SD) of triplicate analyses.
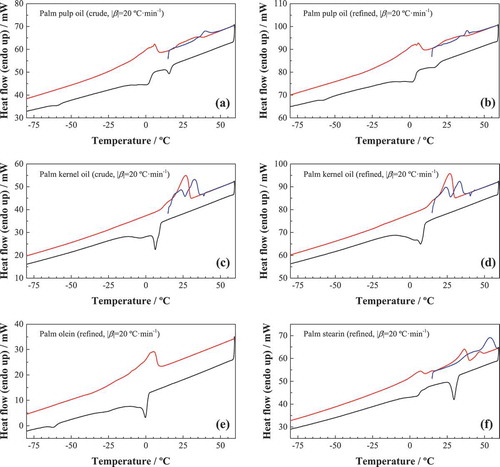
Table 7. Thermal effects of the E. guineensis products in the low-temperature DSC thermograms. All temperatures are in °C. Means (±SD) of triplicate analyses.
Figure 6. Low-temperature DSC curves for various palm oil products: (a) crude palm pulp oil; (b) refined palm pulp oil; (c) crude palm kernel oil; (d) refined palm kernel oil; (e) palm olein; and (f) palm stearin). First heating cycle is shown as a blue solid line, the cooling cycle is shown in black, and the second heating cycle in red.