Figures & data
Figure 1. High performance liquid chromatography (HPLC) analysis of main litchi pericarp anthocyanins at 520 nm (a) and ESI-MS (b), MS2 (c) information of compound 1.
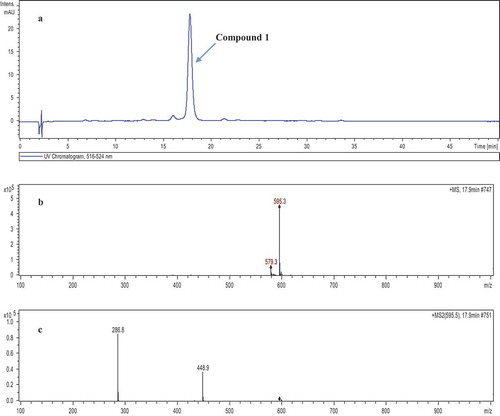
Figure 2. Ultraviolet absorption spectra of litchi pericarp anthocyanins (LPA)-gliadins at different proportions: L, C — LPA concentration of 5 × 10⁻⁶ mol/L; K, C — gliadins concentration of 5 × 10⁻⁶ mol/L; J-A, LPA/gliadins ratio of 2, 4, 6, 8, 10, 12, 14, 16, 18, 20.
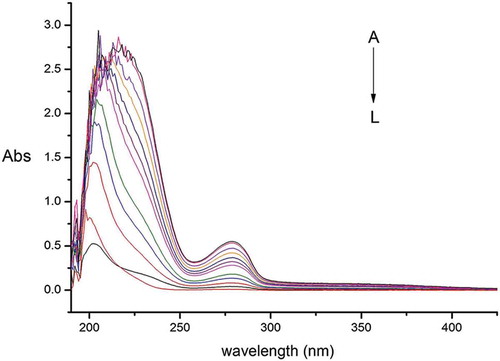
Figure 3. Fluorescence emission spectra (λex = 280 nm) obtained in the presence of increasing concentrations of litchi pericarp anthocyanins (LPA) at temperature of 298 K in the presence of gliadins: A, C – gliadins concentration of 5 × 10⁻⁶ mol/L; for B-K the ratio LPA/gliadins was 2, 4, 6, 8, 10, 12, 14, 16, 18, 20.
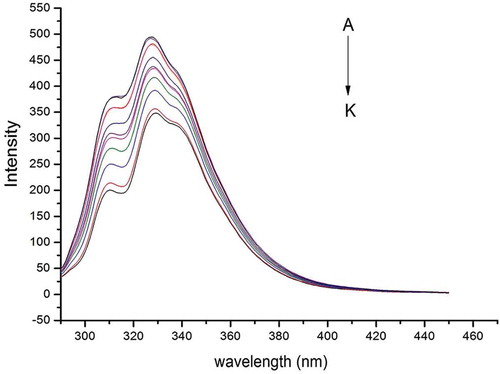
Table 1. Stern–Volmer quenching constants of litchi pericarp anthocyanins (LPA) —gliadins binding at different temperatures.
Table 2. Thermodynamic parameters for litchi pericarp anthocyanins (LPA)—gliadins binding at different temperatures.
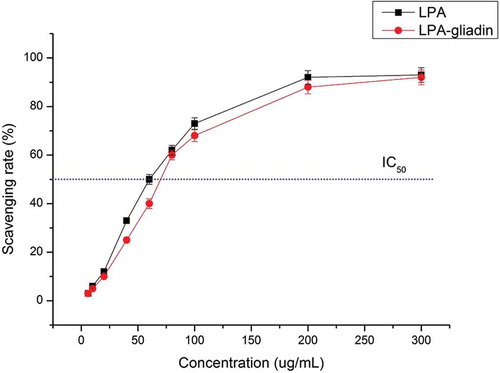
Figure 4. DPPH scavenging rate of litchi pericarp anthocyanins (LPA) and LPA-gliadins (for LPA-gliadins the ratio of LPA/gliadins was 10).