
Figures & data
Figure 3. PCA loadings plots revealed the compounds responsible for distinguishing Thai Oolong tea No. 12 samples.
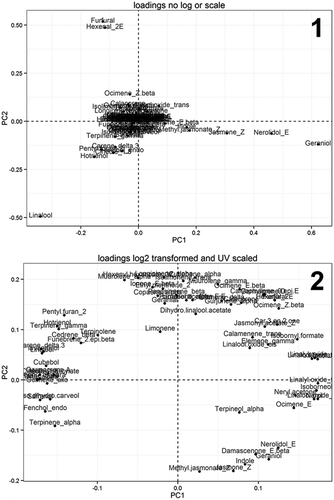
Table 1. Volatile compounds of Oolong tea No. 12 cultivars produced in different areas in Chiang Rai province.
Figure 1. Heatmap of correlation matrix of the volatile compounds in Thai Oolong tea No. 12. The correlation coefficient of volatiles are colour coded from deep red (−1) to deep blue (1).
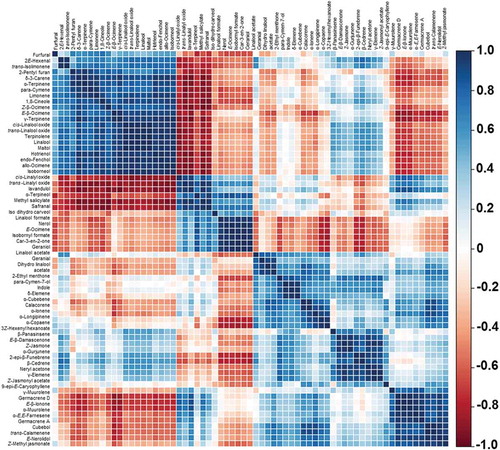
Figure 2. PCA scores plots of all brands based on first and second principal components. Sample No. 1 (N: 19.8582◦, E: 99.7400◦), sample No. 2 (N: 19.7858◦, E: 99.7006◦), sample No. 3 (N: 19.3600◦, E: 99.5087◦), sample No. 4 (N: 20.1984◦, E: 99.8160◦), sample No. 5 (N: 20.1649◦, E: 99.6183◦), sample No. 6 (N: 20.1591◦, E: 99.6172◦), sample No. 7 (N: 20.1984◦, E: 99.8160◦), and sample No. 8 (N: 19.8240◦, E: 99.5736◦).
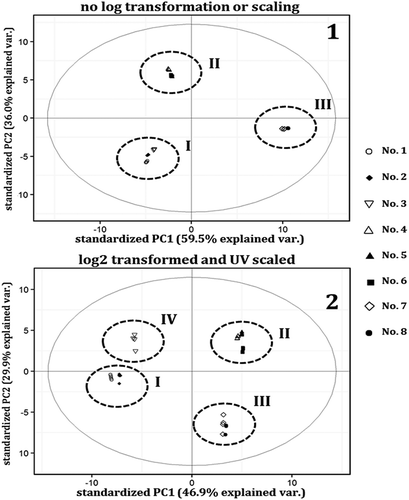
Table 2. Relative content percentage and odor description of Oolong tea volatiles in different clusters.