Figures & data
Figure 1. (A) Digital images of MP/GG mixed gels obtained by CLSM at different GG concentrations (0.0000–0.2000% w/v). The scale bars represent 20 μm. (B) z-stack image of MP gel without GG addition. (C) z-stack image of MP/GG mixed gel (0.2% w/v GG).
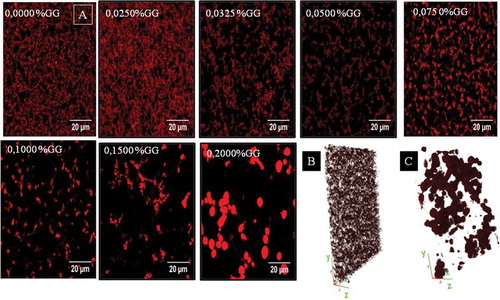
Figure 2. Texture parameters obtained from the CLSM digital images as a function of the GG concentration (0–0.2% w/v).
Figure 3. Box plot representations obtained from the pore size distributions of the rennet-induced MP/GG mixed gels.
Table 1. Penetration parameters (firmness and force at break) of rennet-induced milk protein gels (MP 20% w/v, GG 0–0.2000% w/v).
Figure 4. Force–displacement curve obtained from the penetration test determinations.
Figure 5. Water-holding capacity as a function of GG concentration for rennet-induced MP/GG mixed gels. The dotted line represents the result obtained for the gel sample without GG addition.