Figures & data
Figure 1. Hardness of thermally-processed lotus rhizomes harvested at different times (From June, 2014 to April, 2015, Different lowercase letters indicated the significant difference of hardness of fresh lotus rhizome (P < 0.05). Different capital letters indicated the significant difference of hardness of cooked lotus rhizome (P < 0.05)).
Figure 2. Hardness of the cooked lotus rhizome of different cultivars in April of 2015. Different lowercase letters indicated the significant difference of hardness of fresh and cooked lotus rhizome (P < 0.05).
Figure 3. Microstructure of the lotus rhizomes before and after thermal treatment shown at a magnification of 450 × . A, B, C is the fresh samples, a, b, c is the cooked samples. From left to right they are Lulinhu, Miancheng, and Elian 5 lotus rhizome cultivar.
Figure 4. Percentage of cell wall components of the dry weight of the AIR in different lotus rhizome cultivars at different harvest time.
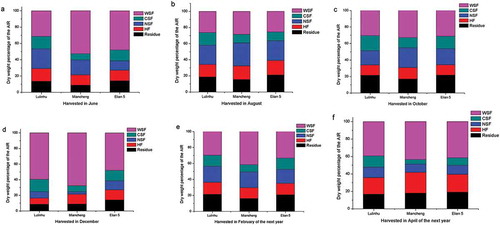
Figure 5. Relationship between of the hardness and the ratio of CSF/WSF of different lotus rhizome cultivars at different harvesting time.
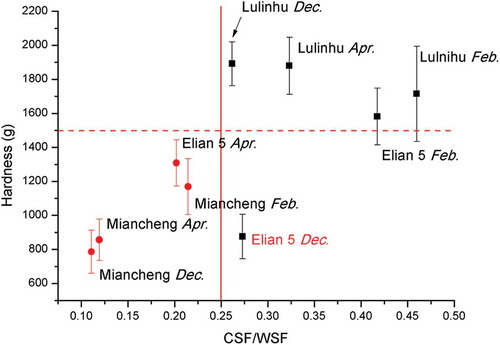
Figure 6. Percentage of the cell wall components of the dry weight of the AIR in different lotus rhizome cultivars harvested in April 2015.
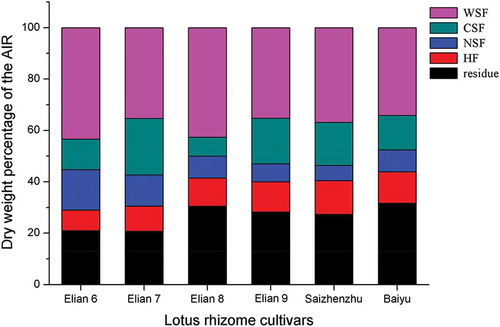
Figure 7. Relationship between of the hardness and the ratio of CSF/WSF of different lotus rhizome cultivars in April, 2015.
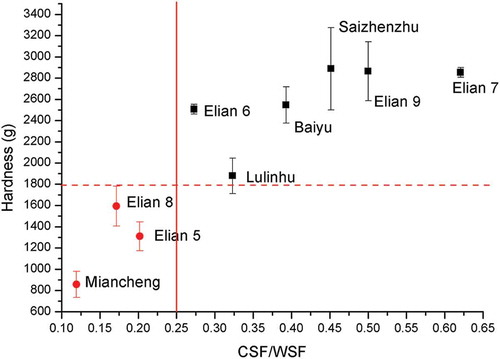
Figure 8. Effect of the thermal processing on the galacturonic acid content of the AIR. Different lowercase letters indicated the significant difference of hardness of fresh and cooked lotus rhizome (P < 0.05).
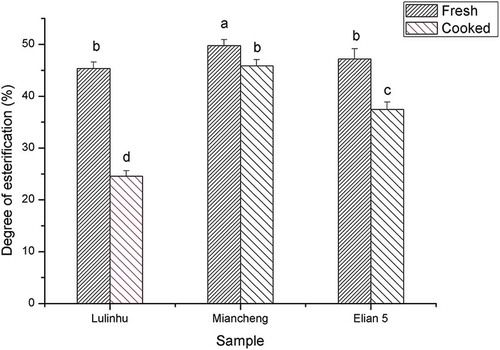
Figure 9. Effect of the thermal processing on the degree of esterification of the AIR. Different lowercase letters indicated the significant difference of hardness of fresh and cooked lotus rhizome (P < 0.05).