
Figures & data
Figure 1. Morphological characters of walnut fruits at different sampling stages.
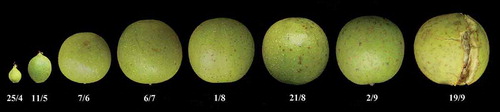
Figure 2. Changes of total phenolic and total flavonoid contents of walnut green husks during different stages of development. Note: Results represent the means ± standard deviation (n = 3). Different little letter near the bar indicates significantly difference at p < 0.05 level.
Table 1. Changes of phenolic compounds of walnut green husks during developmental stages (mg/100 g).
Figure 3. HPLC chromatogram of phenolic standards at 280 nm (A) and 251 nm (B). Peaks: 1 gallic acid; 2 catechin; 3 chlorogenic acid; 4 vanillic acid; 5 caffeic acid; 6 epicatechin; 7 syringic acid; 8 syringaldehyde; 9 ferulic acid; 10 ferulic acid; 11 rutin; 12 ellagic acid; 13 myricetin; 14 quercetin; 15 juglone.
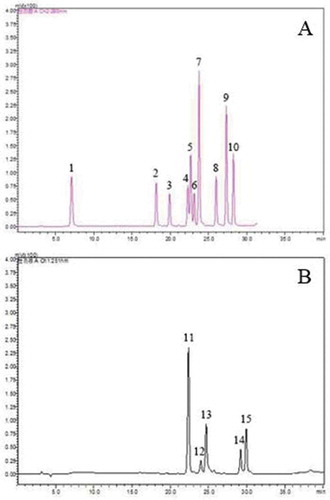
Figure 4. Antioxidant activity changes of walnut green husks during different stages of development. Results represent the means ± standard deviation (n = 3). Different little letter near the bar indicate significantly difference at p < 0.05 level. DPPH: 1,1-diphe-nyl-2-picrylhydrazyl, FRAP: Ferric reducing ability of plasma, ABTS: 2,2′-azinobis-(3-ethylbenzothiazoline-6-sulfonic acid). IC50 means the sample concentration providing 50% inhibition.
Table 2. Correlation coefficient between antioxidant activity and phenolics content.